Synonym: Cumulative Productivity Plot = Hall Plot
One of the Steady-State the Productivity Diagnostics methods based on plotting pressure integral | LaTeX Math Inline |
|---|
body | Pon correlation between cumulative pressure drawdown:| LaTeX Math Block |
|---|
|
G (t) = \int_0^t \left( p_{wf}(\tau) - p_e(\tau) \right) d\tau |
...
and total sandface cumulative offtake/intake:
...
(t) = \int_0^t q_t(\tau) d\tau |
where
| production/injection time |
| |
| |
| LaTeX Math Inline |
|---|
| body | --uriencoded--p_%7Bwf%7D |
|---|
|
| bottomhole pressure as function of time |
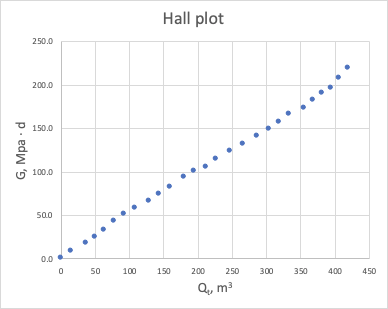
It shows unit slope for SS flow regimeon log-log plot for stabilized reservoir flow:
| LaTeX Math Block |
|---|
|
PG(t) = J^{-1} Q_t(t) |
where
Due to integration procedure the Hall Plot has a better tolerance to uncertainties in formation pressure and bottomhole pressure comparing to Unweighted J-plot and usually results in more accurate estimation of productivity index.
It is highly recommended to plot sandface flowrates rather than surface flowrates to achieve better linearity in correlation for stabilized reservoir flow.
Although it is equally applicable to both to producers and injectors, due to lack of BHP and formation pressure data availability in for producers in most practical cases in the hall plot sought the most of its applications past the Hall plot analysis was mostly applied for water injectors.
The pressure drawdown integral
is usually calculated over interpolated values of formation pressure and bottomhole pressure :| LaTeX Math Block |
|---|
|
G(t) = \int_0^t \left( p_{wf}(\tau) - p_e(\tau) \right) d\tau = \sum_k \left( p_{wf}(\tau_k) - p_e(\tau_k) \right) \delta \tau_k |
See Also
...
Petroleum Industry / Upstream / Production / Subsurface Production / Field Study & Modelling / Production Analysis / SS Productivity Diagnostics