One of the Productivity Diagnostics methods based on correlation between pressure drawdown \Delta p = p_e - p_{wf} and total sandface flowrate q_t(t), where:
p_e | drain-area formation pressure as function of time \tau \tau |
p_{wf} | bottomhole pressure as function of time \tau |
|
| Fig. 1. Unweighted J-plot |
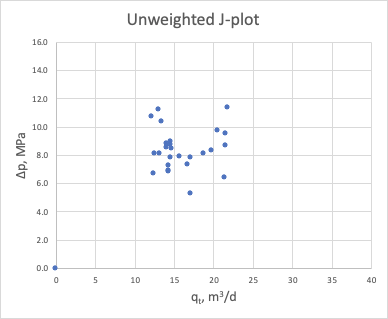
It shows unit slope on log-log plot for stabilized reservoir flow:
| (1) | \Delta p(t) = J^{-1} q_t(t) |
where
J | constant productivity index |
It is highly recommended to plot sandface flowrates rather than surface flowrates to achieve better linearity in correlation for stabilized reservoir flow.
Although it is equally applicable to producers and injectors, due to lack of BHP and formation pressure data availability for producers in most practical cases in the past the normalized Hall plot analysis was mostly applied for water injectors.
Since the BHP and formation pressure data are not readily available for the same time moment the interpolation is required, which usually lead to a high degree of uncertainty.
More practical solutions are achieved via group of cumulative-based Productivity Diagnostics methods: t-weighted J-plot, q-weighted J-plot and Hall Plot.
See Also
Petroleum Industry / Upstream / Production / Subsurface Production / Field Study & Modelling / Production Analysis / Productivity Diagnostics