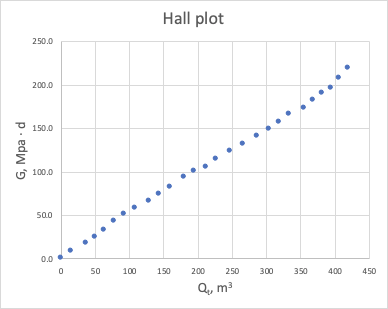
Synonym: Cumulative Productivity Plot = Hall Plot
One of the Productivity Diagnostics methods based on correlation between between cumulative pressure drawdown integral:
| LaTeX Math Block |
|---|
|
G (t) = \frac{1}{t} \int_0^t \left( p_{wf}(\tau) - p_e(\tau) \right) d\tau |
and total sandface flowrate cumulativescumulative offtake/intake:
| LaTeX Math Block |
|---|
|
Q_t(t) = \frac{1}{t} \int_0^t q_t(\tau) d\tau |
where
It shows unit slope on log-log plot for stabilized reservoir flow:
...
Due to integration procedure the Hall Plot has a better tolerance to uncertainties in formation pressure and bottomhole pressure comparing to Unweighted J-plot and usually results in more accurate estimation of productivity index.
It is highly recommended to plot sandface flowrates rather than surface flowrates to achieve better linearity in correlation for In case pressure data is available for a fair interpolation it is recommended to plot sandface cumulatives rather than surface which provides better linearity for stabilized reservoir flow.
...
| LaTeX Math Block |
|---|
|
G(t) = \int_0^t \left( p_{wf}(\tau) - p_e(\tau) \right) d\tau = \sum_k \left( p_{wf}(\tau_k) - p_e(\tau_k) \right) \delta \tau_k |
See Also
...
Petroleum Industry / Upstream / Production / Subsurface Production / Field Study & Modelling / Production Analysis / Productivity Diagnostics
...