A set of direct methods of analyzing the productivity index assuming that both drain-area formation pressure and bottomhole pressure data is available, at least in select time moments:
It is highly recommended to plot sandface flowrates rather than surface flowrates to achieve better linearity in correlation for stabilized reservoir flow.
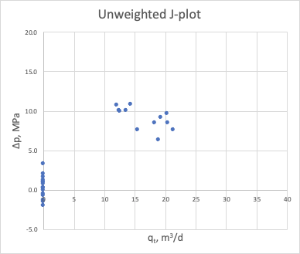
Although it is equally applicable to producers and injectors, due to lack of BHP and formation pressure data availability for producers in most practical cases in the past the J-plots analysis was mostly applied for water injectors.
Since the BHP and formation pressure data are not readily available for the same time moment the interpolation is required, which usually lead to a high degree of uncertainty but due to integration in weighing the J-plots coordinates it is not as high as with raw interpolated values.
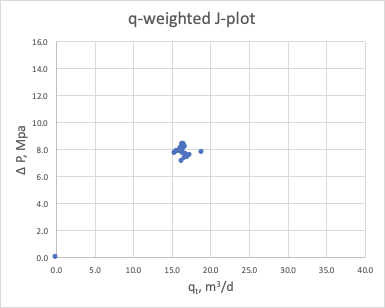
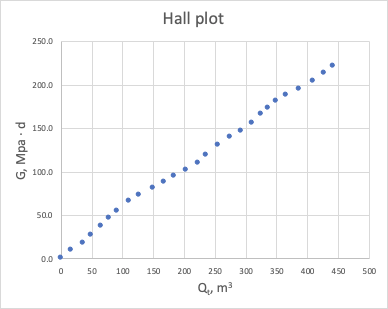
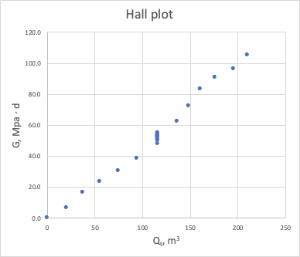
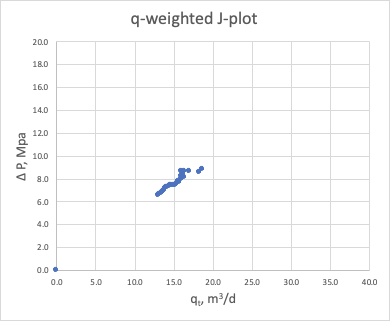
The most effective J-plots are q-weighted J-plot and Hall Plot.
Comparison of various J-plots in different production scenarios is given below.
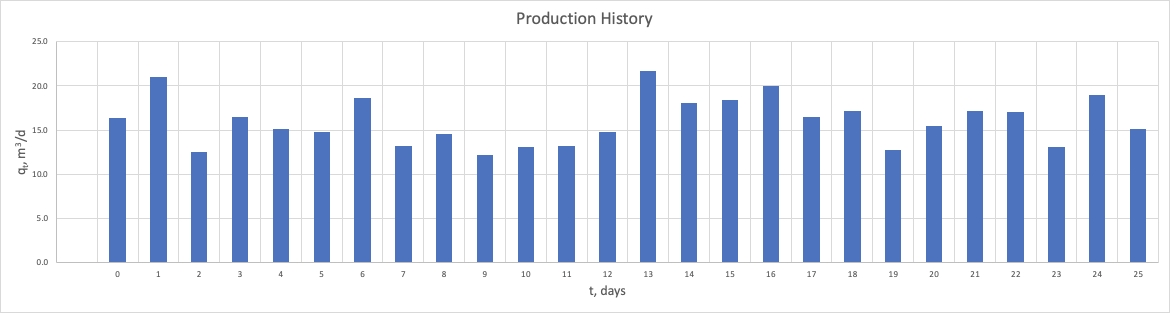
Sample #1 – Constant rate production
| ||
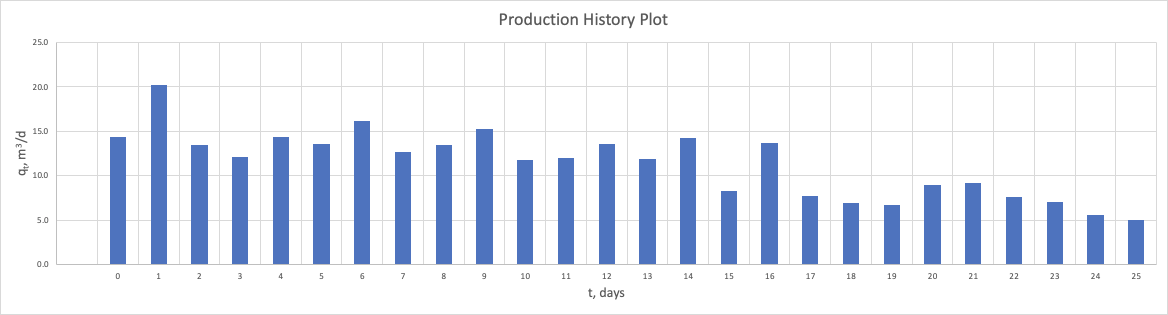
| Fig. 1.1. Production History plot | ||
|
|
|
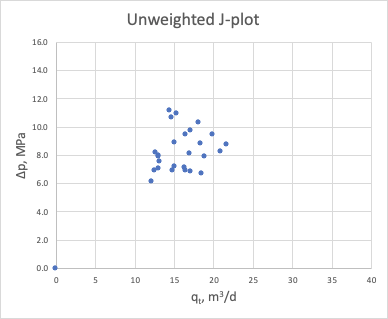
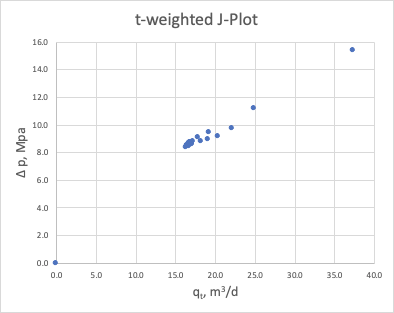
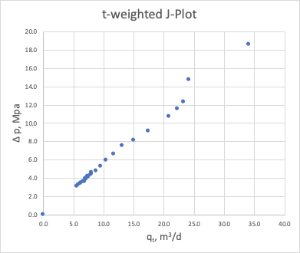
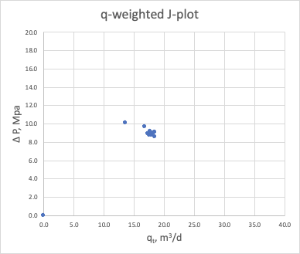
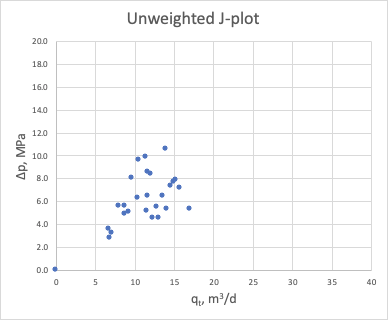
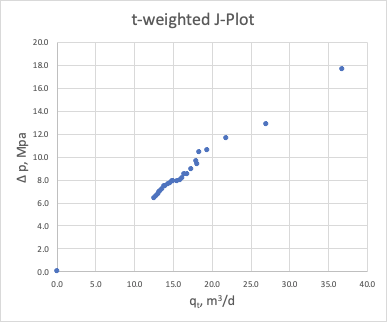
| Fig. 1.2. Unweighted J-plot | Fig. 1.3. t-weighted J-plot | Fig. 1.4. q-weighted J-plot |
|
| |
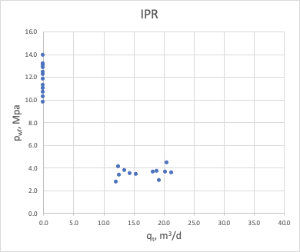
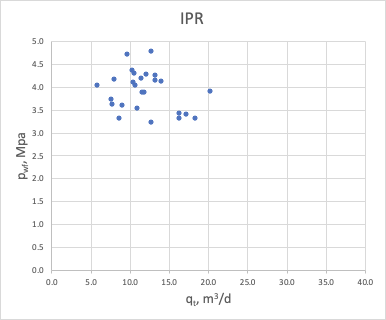
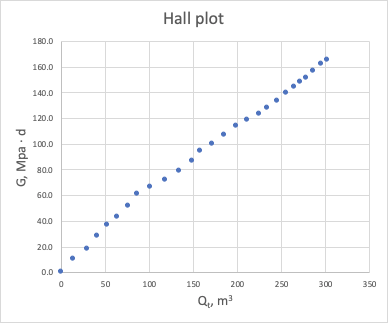
| Fig. 1.5. Inflow Performance Relationship (IPR) | Fig. 1.6. Hall Plot | |
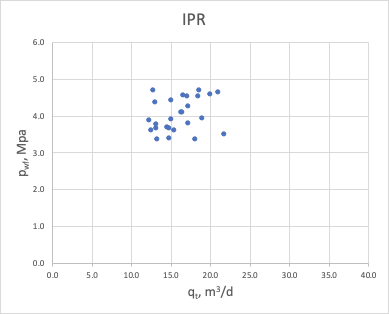
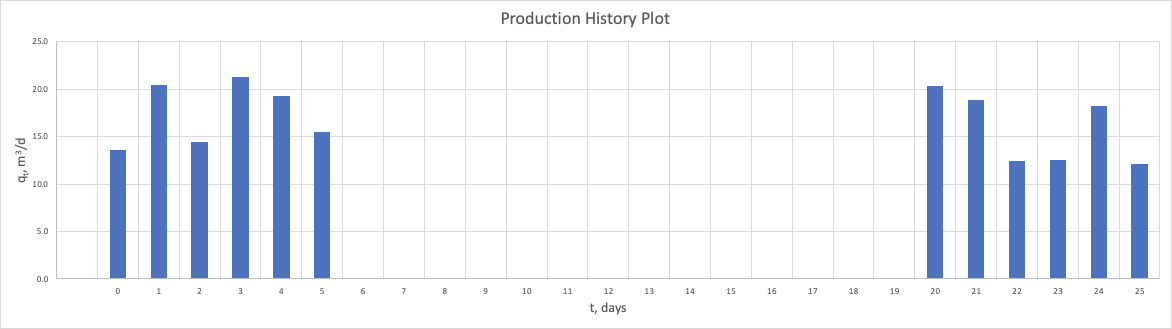
Sample #2 – Constant rate production with shut-down period
| ||
| Fig. 2.1. Production History plot | ||
|
|
|
| Fig. 2.2. Unweighted J-plot | Fig. 2.3. t-weighted J-plot | Fig. 2.4. q-weighted J-plot |
|
| |
| Fig. 2.5. Inflow Performance Relationship (IPR) | Fig. 2.6. Hall Plot | |
Sample #3 – Declining production
| ||
| Fig. 3.1. Production History plot | ||
|
|
|
| Fig. 3.2. Unweighted J-plot | Fig. 3.3. t-weighted J-plot | Fig. 3.4. q-weighted J-plot |
|
| |
| Fig. 3.5. Inflow Performance Relationship (IPR) | Fig. 3.6. Hall Plot | |
See Also
Petroleum Industry / Upstream / Production / Subsurface Production / Field Study & Modelling / Production Analysis / Productivity Diagnostics