Definition
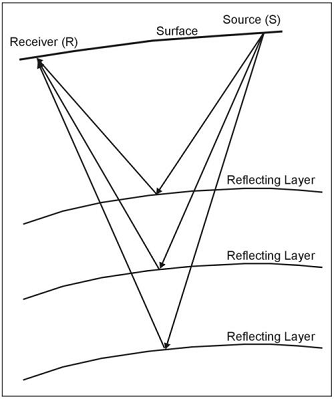
Scanning for acoustic properties of rocks along a certain straight line on the surface by generating a low frequency noise at central point of the line and capturing the acoustic response in array set of sensors along the selected survey line (see Fig. 1).
|
| Fig.1. Seismic reflection schematic |
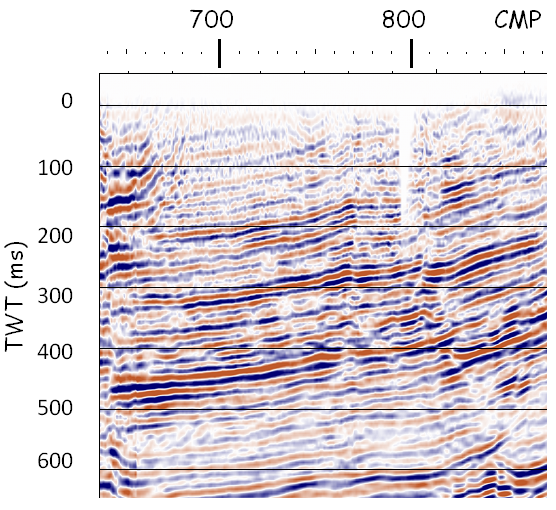
The result of the survey is pictured as vertical profile (see Fig. 2) with:
- Horizontal axis showing a distance along the seismic line
- Vertical axis showing
- either a TWT travel time of acoustic wave towards the seismic reflection boundary at normal-incidence
- or a depth at which the seismic reflection boundary is found (which is related to travel time via p-wave velocity)
- either a TWT travel time of acoustic wave towards the seismic reflection boundary at normal-incidence
- Colour is showing the Reflection Coefficient at inter-bed boundary
|
| Fig. 2. Sample of seismic reflection profile in TWT format. |