|
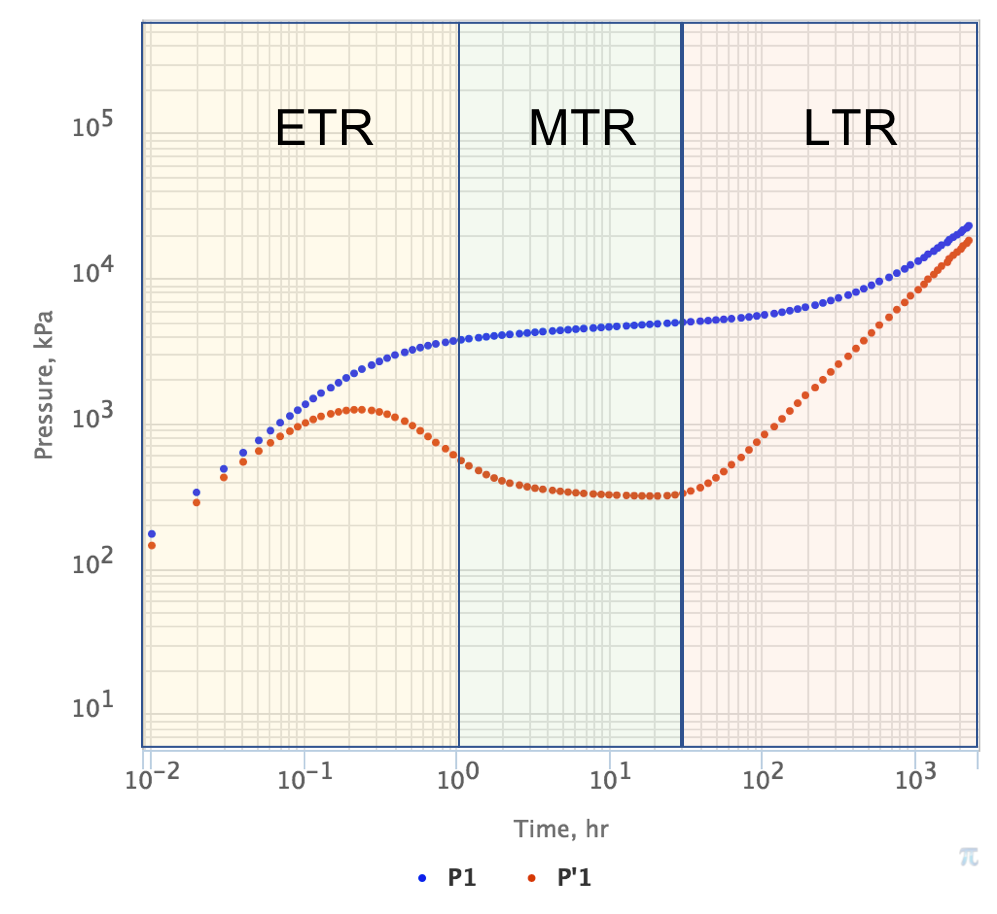
Fig. 4. PTA Diagnostic Plot with ETR, MTR and LTR time zones. Pressure drop is in blue and log-derivative is in red. |
See Also
Petroleum Industry / Upstream / Subsurface E&P Disciplines / Well Testing / Pressure Testing / Pressure Transient Analysis (PTA) / PTA Diagnostic Plot
[ Well & Reservoir Surveillance ] [ Pressure Diffusion ]