Pressure difference between the current bottom-hole pressure p_{wf}(t) and the bottom-hole pressure p_{wf}(t_0) at time moment t=t_0 when flowrate has changed :
| \delta p (t) = p_{wf}(t_0) - p_{wf}(t) |
Pressure drop is:
positive | \delta p (t) >0 | when production rate is increased or injection rate is decreased |
|---|---|---|
negative | \delta p (t) <0 | when production rate is decreased or injection rate is increased |
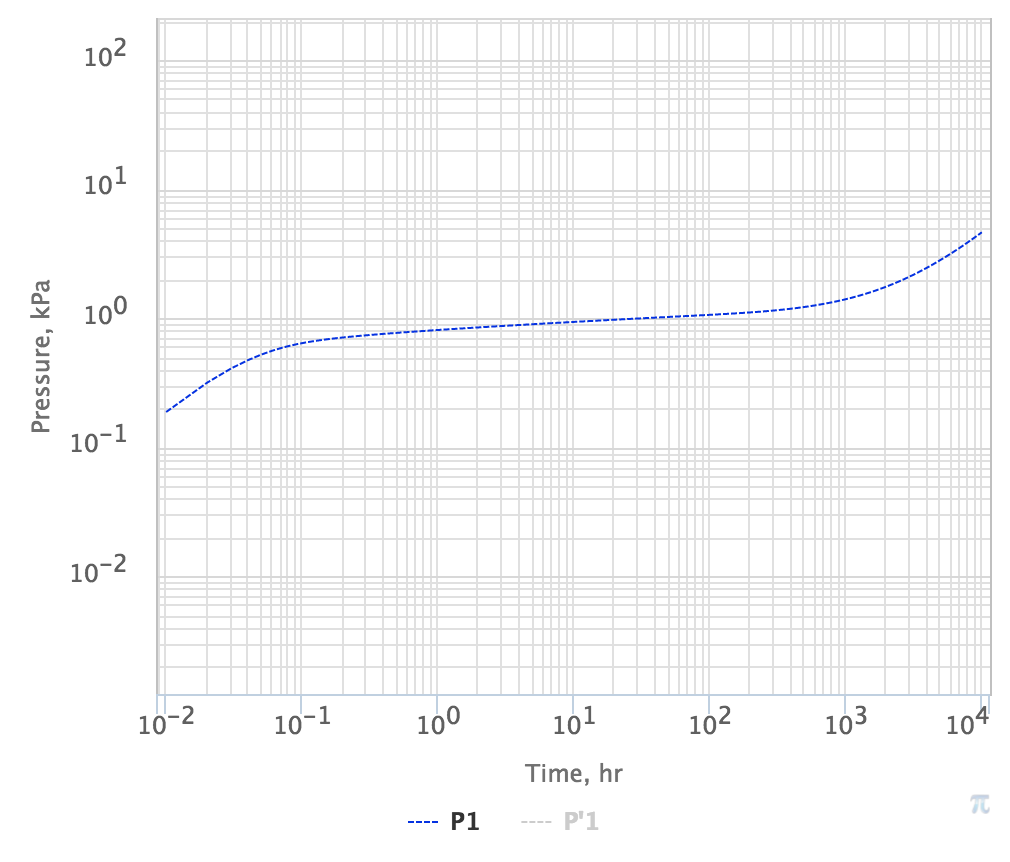
On log-log plots the pressure drop is always pictured as positive (see Fig. 1).
|
|
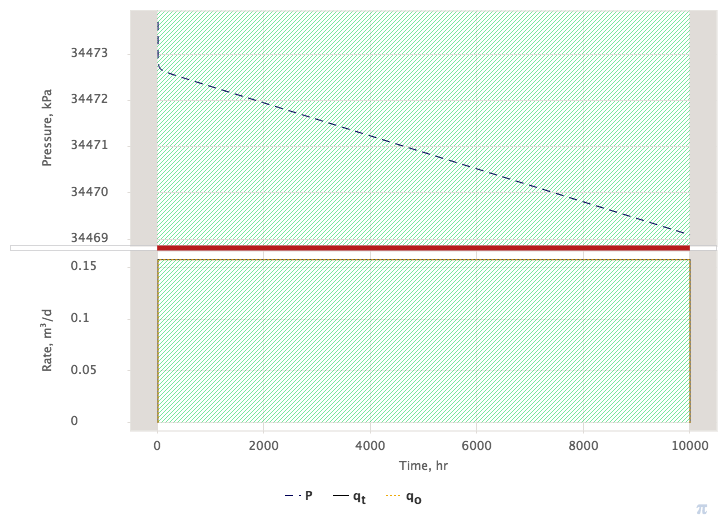
Fig. 1. Example of pressure drop P (in blue ) derived from them BHP data records (Fig. 2) and presented at log-log plot | Fig. 2. A source BHP data records which lead to a pressure drop on Fig. 1 |
In particular case when the well has been shut-in for a long time and bottom-hole pressure has stabilised by the time moment t_0 and when well is opened for flow the pressure drop will be equal to pressure drawdown:
| {\rm pressure } \, \, {\rm drop} = \delta p (t) = p_{wf}(t_0) - p_{wf}(t) = p_e - p_{wf}(t) = \Delta p(t) = {\rm pressure } \, \, {\rm drawdown} |
as the initial bottom-hole pressure value p_{wf}(t_0) represents formation pressure p_e: p_{wf}(t_0) = p_e
See Also
Petroleum Industry / Upstream / Subsurface E&P Disciplines / Well Testing / Pressure Testing / Pressure Transient Analysis (PTA) / PTA Diagnostic Plot
[ Well & Reservoir Surveillance ] [ Pressure Diffusion ] [ Pressure drawdown ]