Specific data processing and interpretation workflow of type of Production Analysis (PA) workflow based on correlation between multi-well production/injection history and bottomhole pressure history from permanent downhole gauges data based on cross-well unit-rate transient responses, usually acquired from multiwell deconvolution.
It has features of both Production Analysis and Well Pressure Testing but since it processes historical data on production rates and permanent downhole gauges and does not require additional activities at well site then from logistical point of view it belongs to the Production Analysis domain.
MRT Workflow
...
- Filter the data for overshoots
- Filter the BHP data with wavelet thresholding to reduce the noise
- Decimate the BHP data (usually 10:1 or 100:1)
- Translate the surface rates to downhole total rate qt with account of BHP at any moment of time
- Synchronise total flowrate qt variations with BHP variations
...
- Filter out shut-ins and hold drawdowns only
- Create material balance (BHP and Pe vs cum Q) and IPR (BHP vs qt) diagnostic metrics over the drawdown history
- Identify the zones of constant productivity index (PI = const), Steady-states (SS) and pseudo steady-states (PSS)
- Assess dynamic drainage volumes Ve for all wells – this is a volume which well is currently draining with account of interference with other wells
...
- Select the constant Productivity Index time segments
- Remove pressure data during shut-in periods except possibly few valuable (representative and similar to drawdown)
- Process PBUs to assess formation pressures
- Input formation pressure as constrains for future deconvolution
- Tune up the weights to match deconvolution trials with PBUs at MTRs
- In case of wells are sitting in the same homogenous reservoir compartment with no behind-casing complications then assume CTR are symmetric to further constrain deconvolution
- Perform deconvolution and QC
- Analyse the response and separate wells by non-interfering groups
- Repeat multiwell deconvolution for each well group and each constant TR time period
...
- Reconstruct formation pressure history
- Reconstruct productivity index history
- Validate if PI is constant and repeat deconvolution exercises over various time intervals if required
- Analyse rates correction and check if it is within the metrological limits and raise allocation concerns and/or advise the corrections
- Create unit-rate spider-plot – a pressure impact diagram showing how one well with unit-rate would be varying the pressure in another well over time
- Create historical rates spider-plot – a pressure impact diagram showing how one well was varying the pressure in another well over time
- Create historical rates pressure interference map showing a current and cumulative impact from one well on another
- Create oil IPR at different formation pressure markups and analyse production optimisation potentials
...
- Perform analytical pressure diffusion modelling of all DTR/CTR wit conventional Pressure Transient Analysis (PTA) using log-derivative log-log plots
- Assess potential drainage volumes Ve,max for all wells – the volumes which well would be draining in case it would be the inly producing well in the field
- Assess well drainage and cross-well transmissibility and compare them against each other and against the OH log interpretation on the map
- Analyse additional diffusion model parameters (skin-factor, fracture length, horizontal length, permeability anisotropy) against expectations
...
- Generate formation pressure and bottom-hole pressure forecasts based on NFA production/injection rates
- Generate formation pressure and production forecasts based on constant BHP
- Additional forecasts based on various BHP and production scenarios
...
| group | editors |
|---|
...
| bgColor | papayawhip |
|---|
...
| title | Editor |
|---|
...
Despite of an obvious appeal this idea has a number of substantial drawbacks:
...
- One Drawdown transient response (DTR) for the PDG well which characterises the pressure response of the PDG well to its own rate variation
- N – 1 cross-well transient responses (CTR) for the interval between PDG and each of the N –1 surrounding wells and which characterises the impact the surrounding wells provide on the formation pressure in PDG well

...
This set of information represent a high value for reservoir engineers for daily planning and also valuable for simulation engineers for 3D model calibration.
The weakest point of RDCB is its inability to distinguish the contour button off two (or more) wells which were changing its rate synchronously (or did not change it at all) during the whole time of the PDG recordings.
Case Study
...
Fig.1. Pressure and Rate history at producing well OP-6
Должна быть картинка иллюстрирующая грубую запись давления ТМС, грубую запись нагнетательной скважины (https://www.arax.team/company/personal/user/20/tasks/task/view/8642/)

Fig. 2. Pressure and Rate history at injecting well Wl4
...
Fig. 3. Cumulative Withdrawals at 01.05.17 (with underlying thikness map)

Fig. 4. Current Withdrawals at 01.05.17 (with underlying thinkness map)

Портянка (https://www.arax.team/company/personal/user/20/tasks/task/view/8642/)
Рис.5. Pressure and Rate history of well OP-6 и and rate history of surrounding wells.
ПХ (https://www.arax.team/company/personal/user/20/tasks/task/view/8642/)
...

...

...
Fig. 7. Reconstruction of formation pressure history and delta pressure at well OP-6
...

...

...
Коррекция дебитов по центральной скважине – зум вокруг явной ошиьки в исторической записи (https://www.arax.team/company/personal/user/20/tasks/task/view/8642/)

...
| group | editors |
|---|
...
| bgColor | papayawhip |
|---|
...
| title | Editor |
|---|
...
Несмотря на видимую привлекательность, на этом пути есть серьезные практически ограничения:
...
The key simulation engine of MRT is Pressure Convolution which is based on Unit-rate Transient Responses (UTR) retrieved from Production rates / PDG data history by means of Pressure Deconvolution.
It does not require new data acquisition at well site and makes use of historical dynamic data records, usually few months or longer.
Motivation
...
Production rate in producing well depends on its productivity index
, current formation pressure LaTeX Math Inline body J
and current BHP LaTeX Math Inline body p_e
:LaTeX Math Inline body --uriencoded--p_%7Bwf%7D
| LaTeX Math Block | ||||
|---|---|---|---|---|
| ||||
q_1^{\uparrow}(t)=J \cdot \left( p_e(t) - p_{wf}(t) \right) |
and as such depends on completion/lift settings (defining
) and how formation pressure is maintained LaTeX Math Inline body --uriencoded--p_%7Bwf%7D(t)
over time.LaTeX Math Inline body p_e = p_e(t)
It keeps declining due to the offtakes:
| LaTeX Math Block | ||||
|---|---|---|---|---|
| ||||
p_e(t) = p_e[q_1^{\uparrow}(t), q_2^{\uparrow}(t), q_3^{\uparrow}(t), \dots] |
and maintained by either aquifer or Fluid Injection and in the latter case depends on injection rates:
| LaTeX Math Block | ||||
|---|---|---|---|---|
| ||||
p_e(t) = p_e[q_1^{\downarrow}(t),q_2^{\downarrow}(t),q_3^{\downarrow}(t),\dots ] |
The combination of
, LaTeX Math Block Reference anchor qup
and LaTeX Math Block Reference anchor peup
lead to the correlation between production rates, injection rates and bottomhole pressure variation.LaTeX Math Block Reference anchor pedown
The ultimate purpose of MRT is to extract maximum information from correlation between the long-term (few months or longer) flowrate history and BHP history (recorded by PDG).
It is essentially based on the fact that BHP in a given well (whether producing or injecting) responds to flowrate variation in the same well and may (or may not) respond to flowrate variation in offset wells.
This information is further related to well flow performance and cross-well connectivity.
Goals & Objectives
...
- Create short-term prediction model on production response to various multi-well production regimes
- Compare the well dynamics and and cross-well connectivity with expectations and identify the candidates for drilling, workover or additional well surveillance
- Assess dynamic reservoir properties
Outputs
...
| Production History | |||||
|---|---|---|---|---|---|
Simulated total subsurface flowrate history,
| |||||
Simulated BHP history,
| |||||
Simulated formation pressure history,
| |||||
Simulated Productivity Index history,
| |||||
Simulated Cross-well interference history,
| |||||
| Production Forecast | |||||
Rate forecast under Pressure Control regime,
| |||||
BHP forecast under Liquid Control regime,
| |||||
Formation pressure forecast under Liquid Control regime,
| |||||
| Diagnostic Metrics | |||||
| Cross-well interference map | |||||
| Unit-rate Transient Response Matrix (UTRM) | |||||
| Unit-rate Transient Response Spider (UTRS) | |||||
| Material Balance Pressure Plot | |||||
| Inflow Performance Relationship (IPR) | |||||
| Cumulative Productivity Plot (Hall Plot) | |||||
| J-plots | |||||
| WOR diagnostics | |||||
| GOR diagnostics | |||||
| Primary Well & Reservoir properties | |||||
| Potential drainage volume | |||||
| Current dynamic drainage volume | |||||
| Secondary Well & Reservoir properties | |||||
| Apparent transmissibility | |||||
| Apparent skin-factor | |||||
| Fracture half-length | |||||
| Dynamic fracture pressure threshold | |||||
Inputs
...
| Primary Inputs | |
|---|---|
| PVT model | |
| Production/injection history for all wells in a test | |
| Bottom-hole pressure (BHP) history for at least one well | |
| Additional Inputs | |
| Well locations map | |
| Well schematic | |
| Surface Well Tests | |
| Production Logging Reports | |
| Cased-Hole Pressure Transient Test Reports | |
| SGS – Static Gradient Survey Reports | |
| Well Intervention History | |
Applications
...
| Production forecasts | |
|---|---|
| Predict formation pressure without shutting wells down and avoiding production deferment | |
| Short-term production forecasts for different multi-well production scenarios | |
| Selecting well-intervention candidates | |
| Identify well-intervention candidates with possible thief production/injection | |
| Identify well-intervention candidates with possibly inefficient reservoir flow profile | |
| Identifywell-intervention candidates for Rate Optimization | |
| Identifywell-intervention candidates for producer ↔ injector conversion | |
| Dynamic Model Calibration | |
| Adjusting historical production allocation | |
| Adjusting the potential reservoir volume extension at different directions | |
| Adjusting faults / channels / compartmentalization | |
| Adjusting fracture model | |
Workflow
...
Examples
...
See Also
...
Petroleum Industry / Upstream / Production / Subsurface Production / Field Study & Modelling / Production Analysis
[ MRT @sample ] [ MRT @workflow ]
[ Permanent downhole gauges (PDG) ] [ Pressure Convolution ] [ Pressure Deconvolution ] [ Multiwell Deconvolution (MDCV) ]
[ Radial Deconvolution (RDCV) ][ RDCV @model ][ RDCV @sample ]
[ Cross-well Deconvolution (XDCV) ][ XDCV @model ][ XDCV @sample ]
[ Material Balance Analysis ] [ Capacitance Resistance Model (CRM) ] [ Pressure Transient Analysis (PTA) ]
...
- Одна диагональная для центральной скважины ТМС, которая характеризует влияния смены режимов центральной скважины на ее собственное забойной давление
- N-1 кросс-диагональных ПХ в направлении окружающих ее скважин, которые характеризуют влияние смены режимов окружающих скважин на пластовое давление в центральной скважины
...
Эта информация представляет собой большую ценность для оперативного анализа разработки, а также может использоваться для калибровки 3Д моделей.
Необходимо помнить, что помимо качества исходной информации методы МДКВ имеют и естественные ограничения по информативности, в случае если режимы скважин менялись слабо и редко.
Пример
...
Рис.1. Запись давления ТМС и дебитов скважины OP-6
Должна быть картинка иллюстрирующая грубую запись давления ТМС, грубую запись нагнетательной скважины (https://www.arax.team/company/personal/user/20/tasks/task/view/8642/)
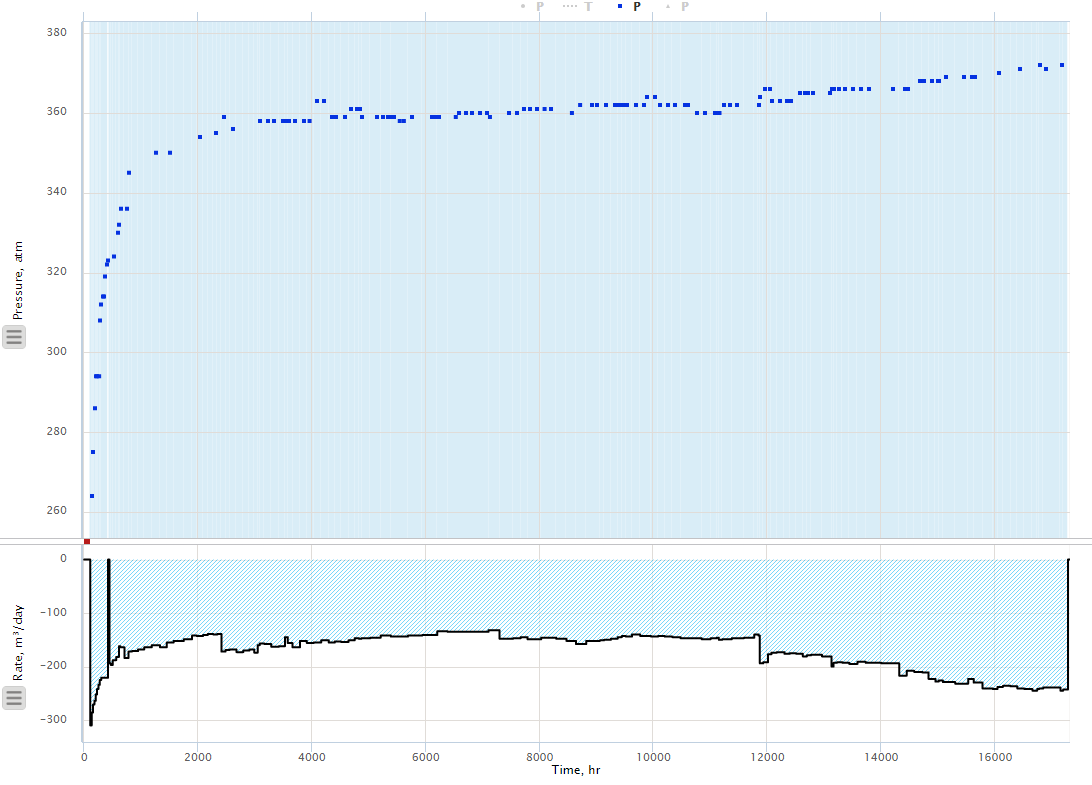
Рис.2. Запись давления и дебитов скважины Wl4
Карта с накопленными и текущими отборами (https://www.arax.team/company/personal/user/20/tasks/task/view/8642/)
Рис.3. Карта накопленных отборов на 01.05.17 (подложка - карта толщин)

Рис.4. Карта текущих отборов на 01.05.17 (подложка - карта толщин)
Портянка (https://www.arax.team/company/personal/user/20/tasks/task/view/8642/)
Рис.5. Дебиты и давления скважины OP-6 и дебиты окружающих скважин.
ПХ (https://www.arax.team/company/personal/user/20/tasks/task/view/8642/)
...

...

...
Рис. 7. Реконструкция пластового давления и депрессии на пласт в скважине OP-6
...

...

...
Коррекция дебитов по центральной скважине – зум вокруг явной ошиьки в исторической записи (https://www.arax.team/company/personal/user/20/tasks/task/view/8642/)
...