...
|
Fig. 1. PTA Diagnostic Plot with ETR, MTR and LTR time zones. Pressure drop is in blue and log-derivative is in red. |
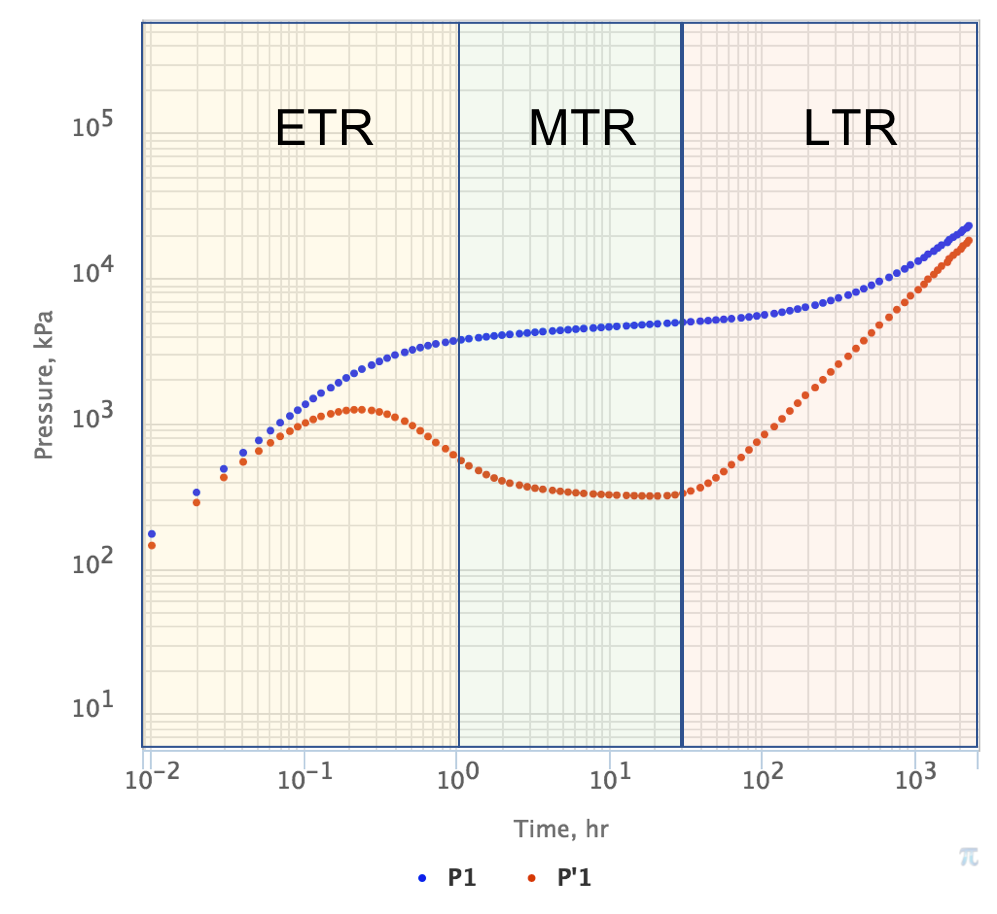
In small-volume reservoirs with high permeability the LTR may occur immediately after the ETR.
In some cases the wellbore storage and well-reservoir contact may extend ETR all the way up to LTR.
In these case the MTR may not be observed on PTA Diagnostic Plot.
See Also
...
Petroleum Industry / Upstream / Subsurface E&P Disciplines / Well Testing / Pressure Testing / Pressure Transient Analysis (PTA) / PTA Diagnostic Plot
...