The initial time interval of the pressure transient dominated by wellbore storage and hydraulic fracture effects (see MTR at Fig. 1)
|
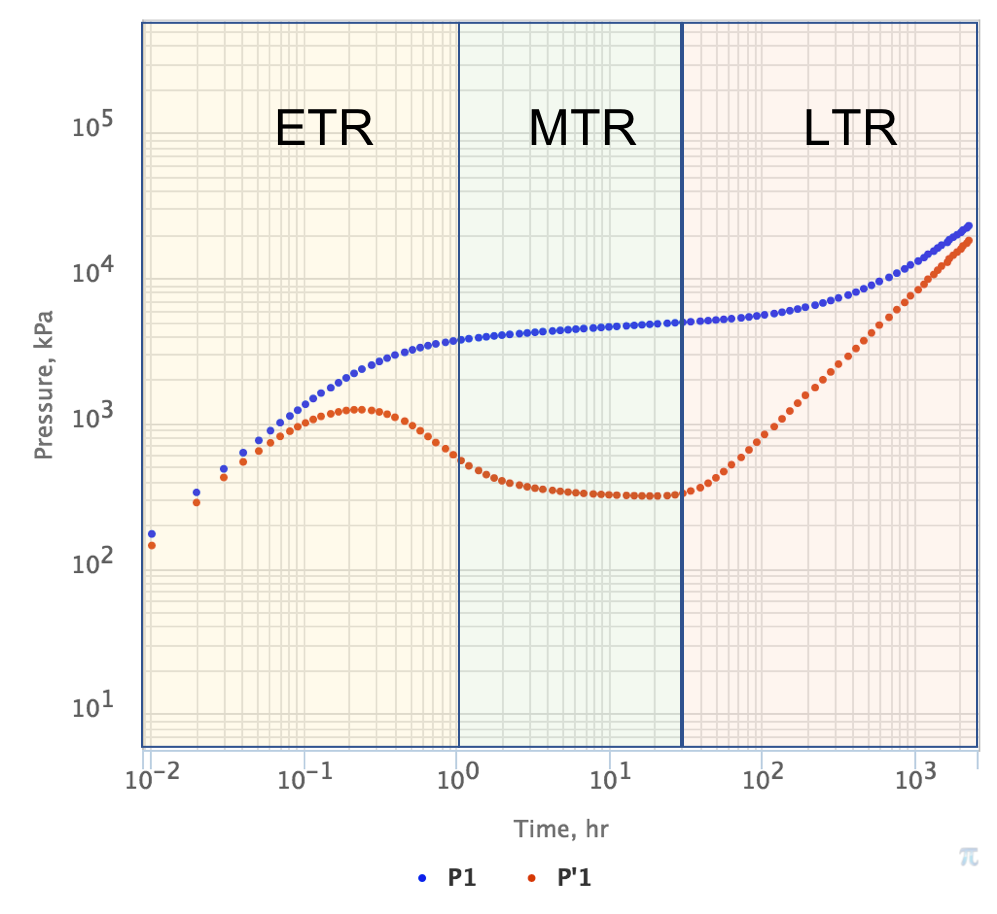
Fig. 41. PTA Diagnostic Plot with ETR, MTR and LTR time zones. Pressure drop is in blue and log-derivative is in red. |
...