changes.mady.by.user Arthur Aslanyan (Nafta College)
Saved on Jan 24, 2019
@wikipedia
Image Added
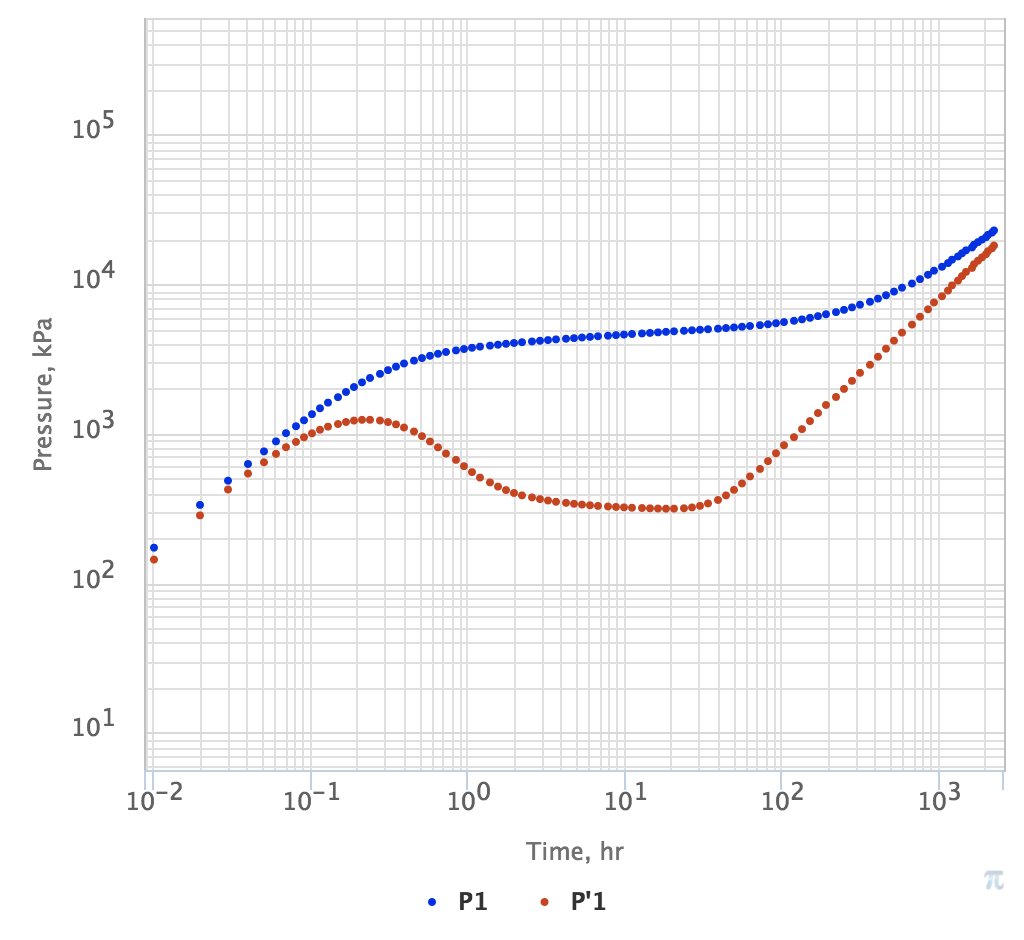
Fig. 1. Example of pressure log-log plot showing DTR
Pressure drop P in blue and log-derivative P' in red
...