...
|
|
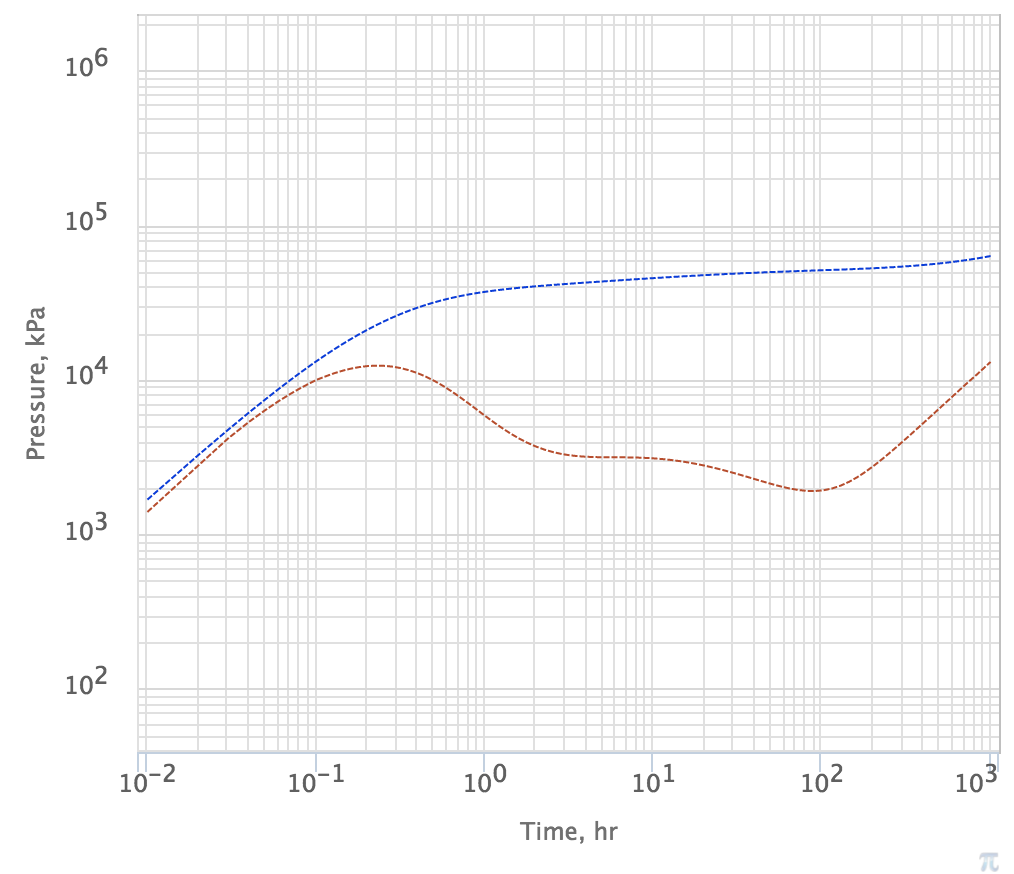
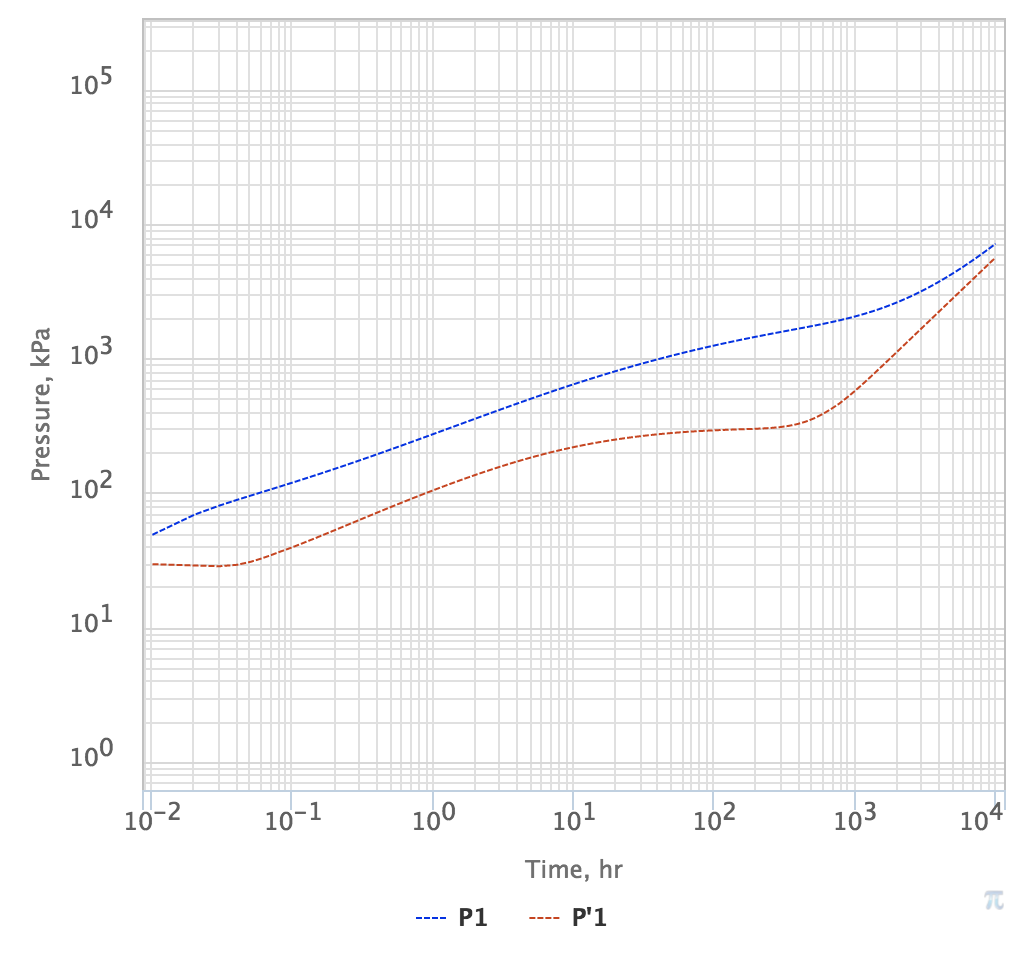
Fig. 1. Transient response in vertical producerwell. Pressure drop is in blue and log-derivate of Pressure drop is in red | Fig. 2. Transient response in horizontal producerwell Pressure drop is in blue and log-derivate of Pressure drop is in red |
...