Undersaturated Oil Reservoir with initial temperature slightly lower the pseudo-critical temperature and the Vapour Liquid Envelope having quality lines tighter spaced at reservoir conditions while separator conditions lying on relatively high quality lines.
A small reduction of pressure below the bubble point vaporizes a significant fraction of the oil.
|
Fig. 1. Production path of the Volatile Oil Reservoir on the Phase Equilibrium Diagram. The dash lines showing the Vapour Quality Lines (with inverse numbering). The downward solid black arrow shows a reservoir pressure depletion path. The downward grey dash arrow shows a wellbore lift pressure drop path. |
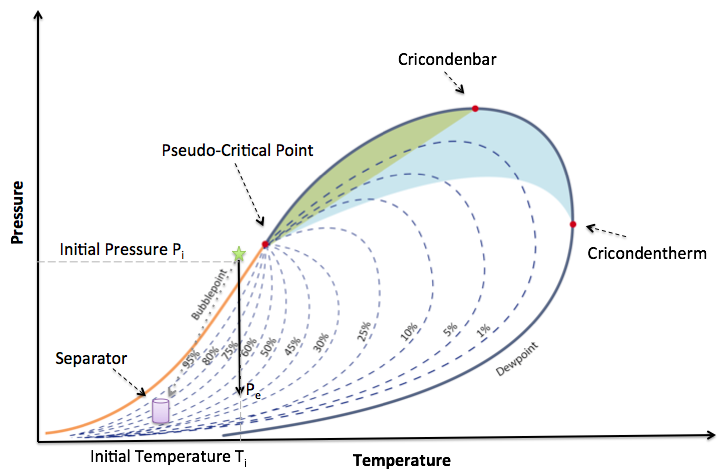
Table 1 – Example of Volatile Oil composition (in mol % )
| CO2 | 1.82 |
| N2 | 0.24 |
| C1 | 57.60 |
| C2 | 7.35 |
| C3 | 4.21 |
| i C4 | 0.74 |
| n C4 | 2.07 |
| i C5 | 0.53 |
| n C5 | 0.95 |
| C6s | 1.92 |
| C7+ | 22.57 |
| Rs (SCF/STB) | 1465 |
| Rv (STB/MMSCF) | 680 |
| API gravity | 36.7 |
| M7+ | 240 |
| γ7+ | 0.864 |
See Also
Petroleum Industry / Upstream / Subsurface E&P Disciplines / Petroleum Geology / Petroleum reservoir / Hydrocarbon reservoir / Oil Reservoir / Undersaturated Oil Reservoir
[ Hydrocarbon Reserves ][ Depletion ]
[ Volatile Oil ][ Volatile Oil Fluid @model ]
References
@article{osti_5245860,
title = {Volatile oils and retrograde gases - What's the difference},
author = {McCain, Jr, W D and Bridges, B},
abstractNote = {Part 1 showed that at reservoir conditions, volatile oils exhibit bubble points and retrograde gases exhibit dew points. The article contained a graph of initial producing gas-oil ratio plotted against concentration of heptanes plus in the fluid. This paper reproduces a portion of that graph with the data points indicating that the fluid had a dew point or a bubble point at reservoir conditions. The scatter in the data reflects the compositional differences among the fluids and the differences in surface separation facilities and conditions. In this graph, only three fluids have dew points and initial producing gas-oil ratios less than 3,200 scf/STB, and only one fluid reaches a bubble point above this value. Therefore, a value of 3,200 scf/STB appears to be a good cutoff between volatile oils and retrograde gases.},
doi = {},
url = {https://www.osti.gov/biblio/5245860}, journal = {Petroleum Engineer International; (United States)},
issn = {0164-8322},
number = ,
volume = 66:1,
place = {United States},
year = {1994},
month = {1}
}