You are viewing an old version of this page. View the current version.
Compare with Current
View Page History
« Previous
Version 5
Next »
|
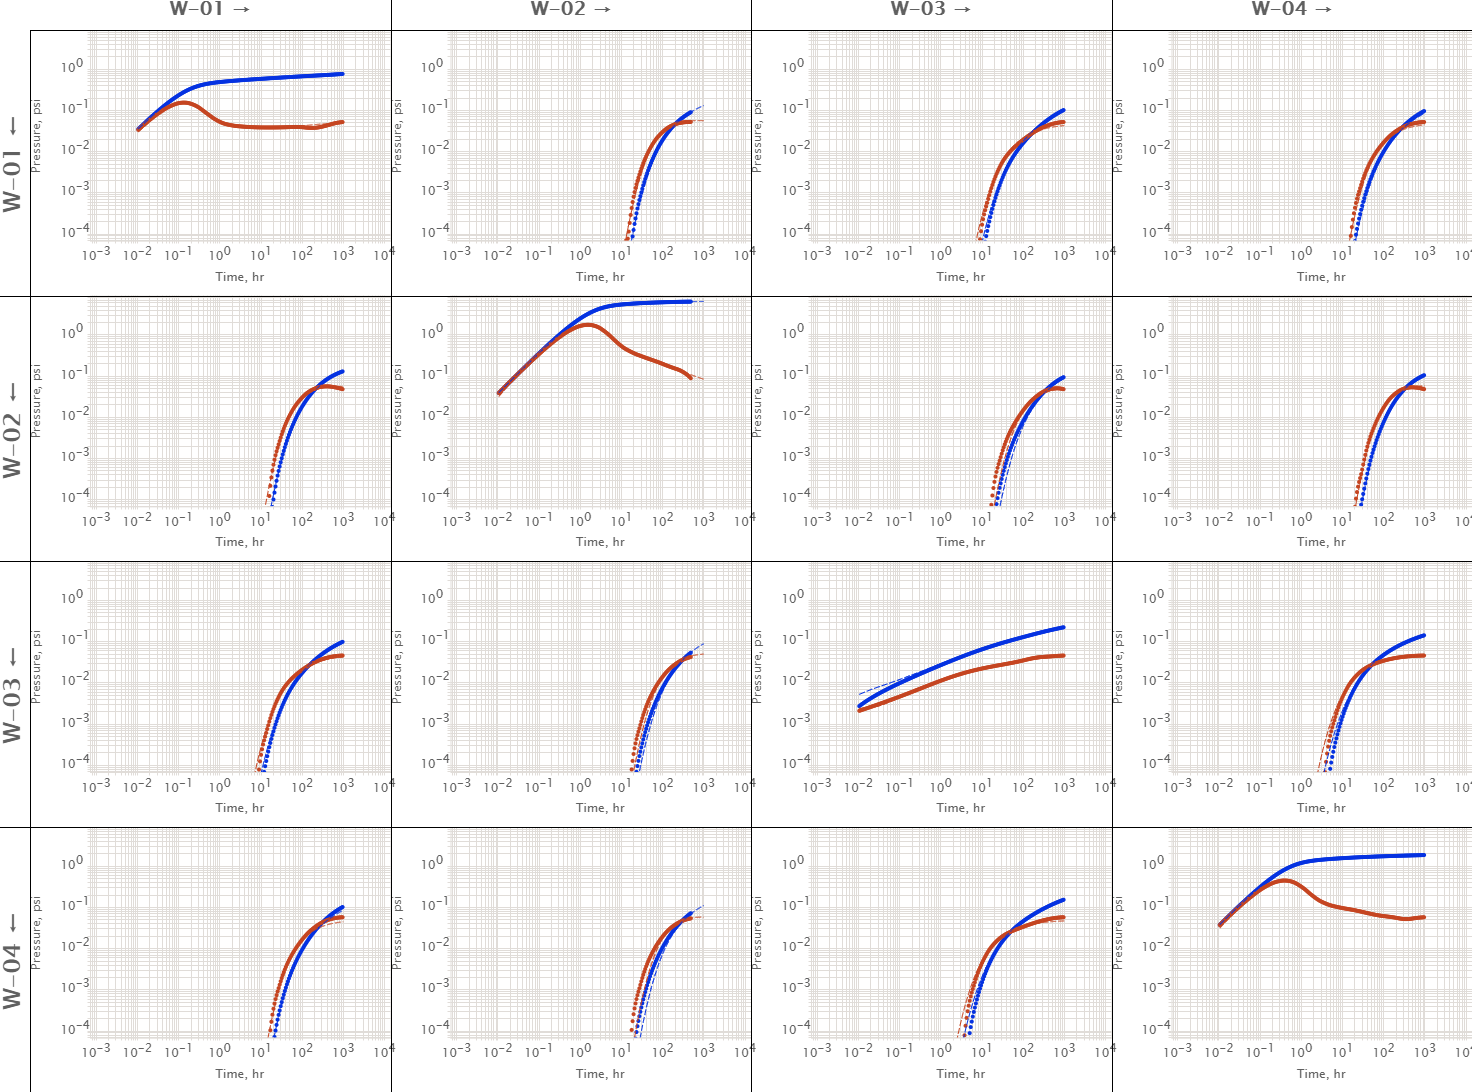
Fig. 3. UTR output diagram from MDCV which is a key element of MRT. The column wells showing pressure response to row wells. Diagonal elements are showing self-response DTRs. Non-diagonal elements showing cross-well response CTRs. |
See Also
Petroleum Industry / Upstream / Production / Subsurface Production / Field Study & Modelling / Production Analysis / Multiwell Retrospective Testing (MRT)