| Fig. 1. Well locations with current production bubble map over the structural map |
|
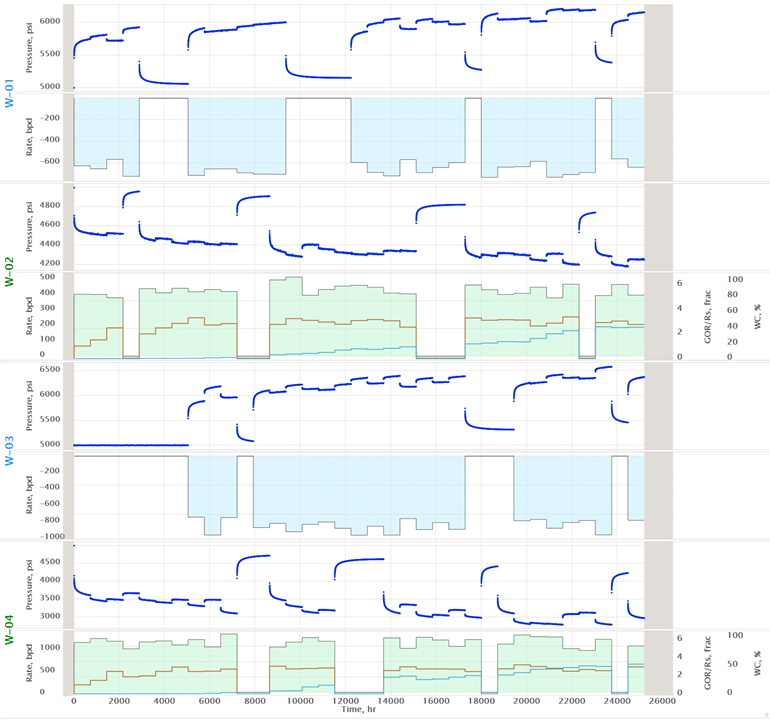
| Fig. 2. Production / Injection history |
Outputs
Production History
| Fig. 3. Simulated total subsurface flowrate history | Fig. 4. Simulated BHP history |
| Fig.5. Simulated formation pressure history | Fig. 6. Simulated Productivity Index history |
| Fig. 7. Simulated Cross-well interference history |
Production Forecast
| Fig. 8. Rate forecast under Pressure Control regime | Fig. 9. BHP forecast under Liquid Control regime |
| Fig. 10. Formation pressure forecast under Liquid Control regime |
Diagnostic Metrics
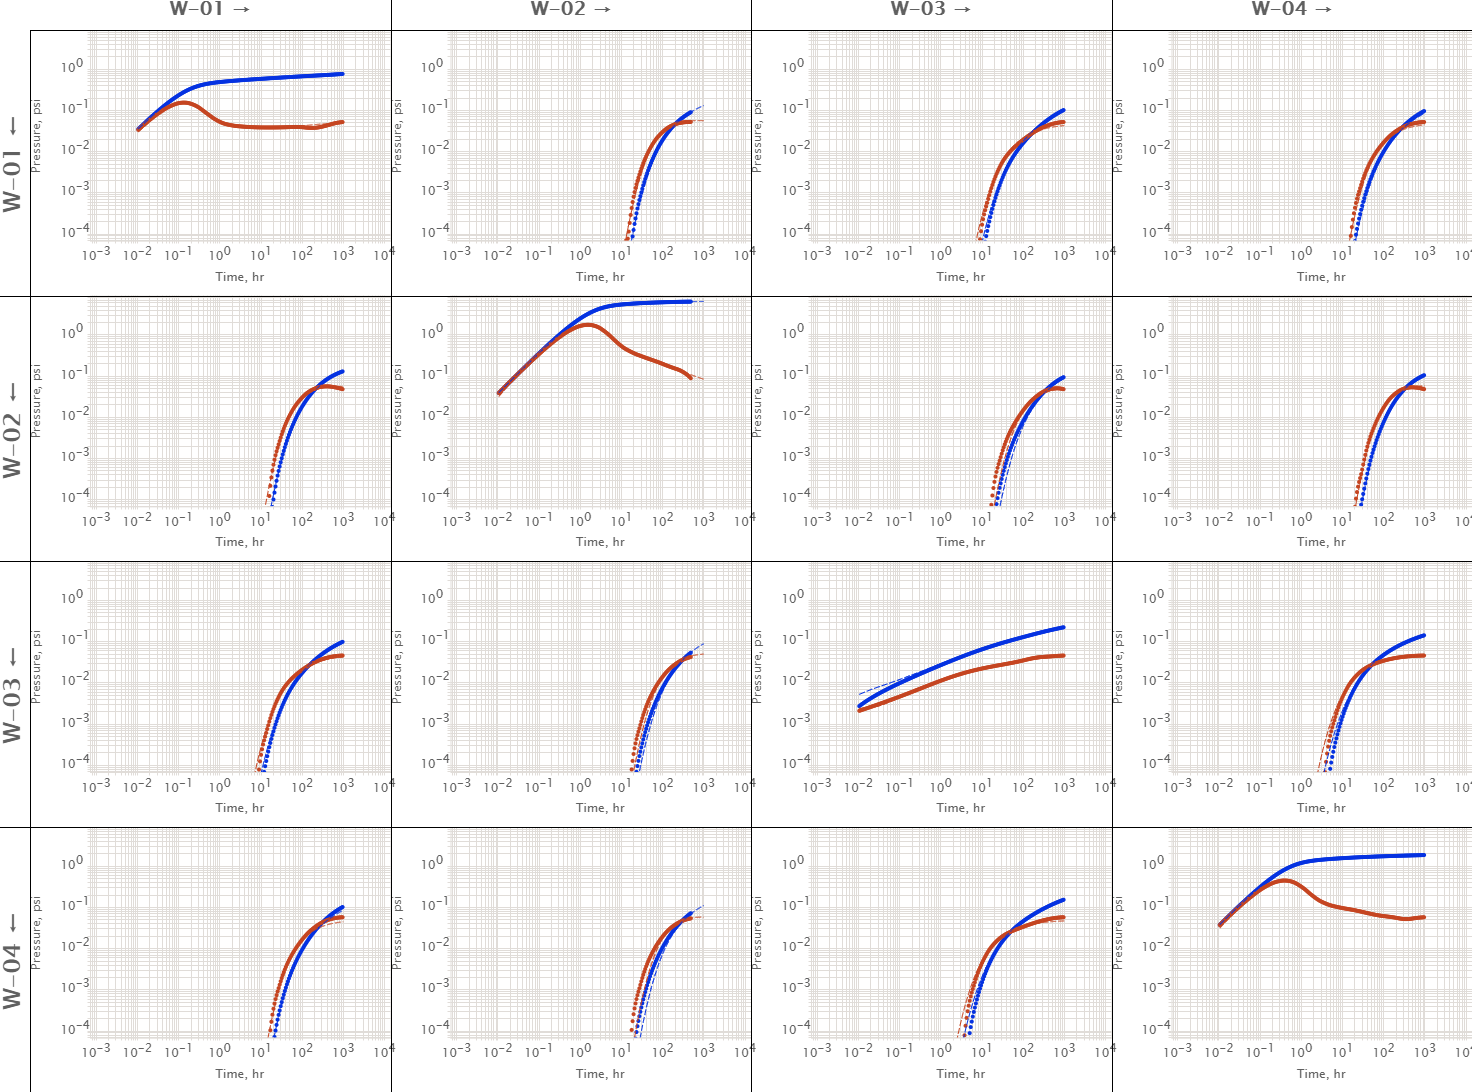
| Fig. 11. Cross-well interference map | Fig. 12. Unit-rate Transient Response Matrix (UTRM) |
| Fig. 13. Unit-rate Transient Response Spider (UTRS) | Fig. 14. Material Balance Pressure Plot |
| Fig. 17. J-plots | Fig. 18. WOR diagnostics |
| Fig. 19. GOR diagnostics |
Primary Well & Reservoir properties
| Fig. 20. Potential drainage volume | Fig. 21. Current dynamic drainage volume |
Secondary Well & Reservoir properties
| Fig. 22. Apparent transmissibility | Fig. 23. Apparent skin-factor |
| Fig. 24. Fracture half-length | Fig. 25. Dynamic fracture pressure threshold |
|
Fig. XXX. UTR output diagram from MDCV which is a key element of MRT. The column wells showing pressure response to row wells. Diagonal elements are showing self-response DTRs. Non-diagonal elements showing cross-well response CTRs. |
See Also
Petroleum Industry / Upstream / Production / Subsurface Production / Field Study & Modelling / Production Analysis / Multiwell Retrospective Testing (MRT)