One of the Productivity Diagnostics methods based on correlation between rate-weighted average pressure drawdown:
| (1) | \overline {\delta p} (t) = \frac{1}{Q} \int_0^t \left( p_{wf}(\tau) - p_e(\tau) \right) q_t d\tau |
and rate-weighted average total sandface flowrate:
| (2) | \bar q_t(t) = \frac{1}{Q} \int_0^t q^2_t(\tau) d\tau |
where
\tau | production/injection time |
q_t | total sandface flowrate as function of time \tau |
p_e | drain-area formation pressure as function of time \tau \tau |
p_{wf} | bottomhole pressure as function of time \tau |
|
Fig. 1.4. q-weighted J-plot |
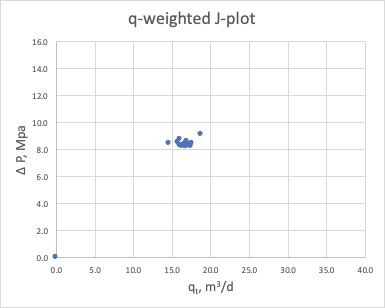
It shows unit slope on log-log plot for stabilized reservoir flow:
| (3) | \overline {\delta p}(t) = J^{-1} \bar q_t(t) |
where
J | constant productivity index |
It is highly recommended to plot sandface flowrates rather than surface flowrates to achieve better linearity in correlation for stabilized reservoir flow.
The average pressure drawdown \overline {\delta p} (t) is usually calculated over interpolated values of formation pressure and bottomhole pressure :
| \overline {\delta p} (t) = \frac{1}{Q} \int_0^t \left( p_{wf}(\tau) - p_e(\tau) \right) q_t(\tau) \, d\tau = \frac{1}{Q} \sum_k \left( p_{wf}(\tau_k) - p_e(\tau_k) \right) q_t (\tau_k) \, \delta \tau_k |
The main difference between weighted-average and Normalized Hall Plot is the averaging methodology.
The Normalized Hall Plot gives equal weight to all data points \displaystyle w(t) = \frac{1}{t}, while q-weighted J-plot gives more weight to higher flowrate data points, lower weight to lower flowrate data points and zero weight to no-flow data points ( q=0): \displaystyle w(t) = \frac{q_t}{Q}.
When flowrate is constant q=\rm const both methods are equivalent because \displaystyle w(t) = \frac{q_t}{Q} =\frac{1}{t} .
See Also
Petroleum Industry / Upstream / Production / Subsurface Production / Field Study & Modelling / Production Analysis / Productivity Diagnostics