| (1) | \rho_p(x,y) = \frac{{\rm cov}(x,y)}{\sigma(x) \sigma(y)} |
where
\{ (x, y) \} = \{ (x_1, y_1), \, (x_2, y_2), \, ... (x_n, y_n) \} | discrete array of variables x and y |
{\rm cov}(x,y) | covariance between variables x and y |
\sigma(x), \sigma(y) | standard deviation of property x and y |
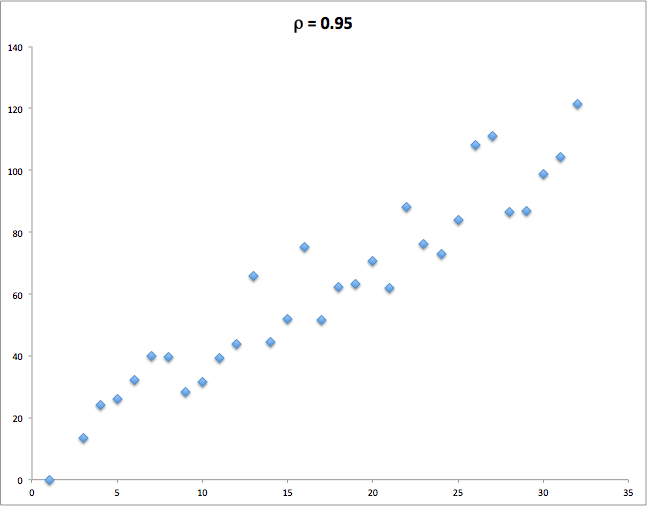
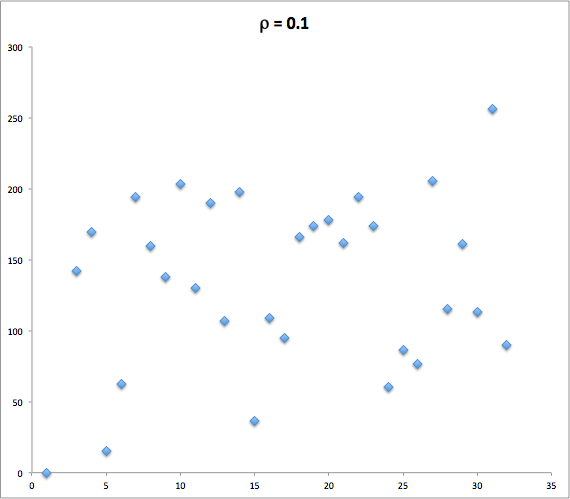
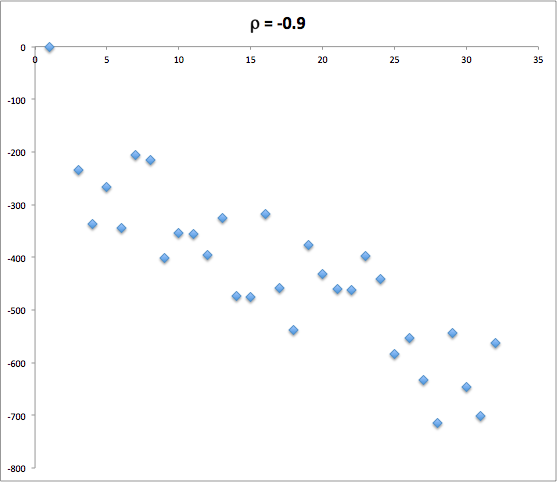
Pearson correlation coefficient ranges between -1 and 1 and indicates how close the two properties can be related by a linear correlation:
| y_i = a x_i + b, \quad \forall \, i=1..N |
with a certain pick on a and b (see Fig. 1 – Fig. 3 for examples).
|
|
|
| Fig. 1. Highly correlated properties | Fig. 2. Poorely correlated properties | Fig. 3. Highly anti-correlated properties |