For sample sets of two statistical variables x=\{x_i \, | \, i=1..n \} and y=\{y_i \, | \, i=1..n \}:
| (1) | \rho_P(x,y) = \frac{{\rm cov}(x,y)}{\sigma(x) \sigma(y)} = \frac{ \sum\limits^n_{i=1} (x_i - \bar x)( y_i - \bar y)}{\sqrt{\sum\limits_i (x_i - \bar x)^2} \cdot \sqrt{\sum\limits_i (y_i - \bar y)^2}} |
where
where
\displaystyle \bar x = \frac{1}{n} \sum\limits_{i=1}^n x_i | sample mean of variable x |
\displaystyle \bar y = \frac{1}{n} \sum\limits_{i=1}^n y_i | sample mean of variable y |
x=\{ x_1, \, x_2, \, ... x_n \} and y=\{ y_1, \, y_2, \, ... y_n \} | finite arrays of x-variable and y-variable values |
{\rm cov}(x,y) | covariance between x-variable and y-variable |
\sigma(x), \sigma(y) | standard deviation of x-variable and y-variable |
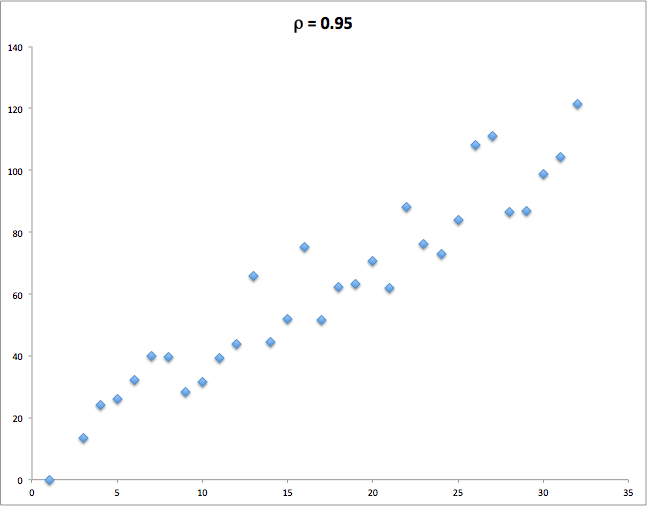
Pearson correlation coefficient ranges between -1 and 1 and indicates how accurately the two variables can be approximated by a linear correlation:
| y_i = a \, x_i + b, \quad \forall \, i=1..n |
with a certain pick on a and b.
- Maximum value
\rho_p(x,y) = + 1 relates to perfect linear correlation with
a>0 (see also Fig. 1)
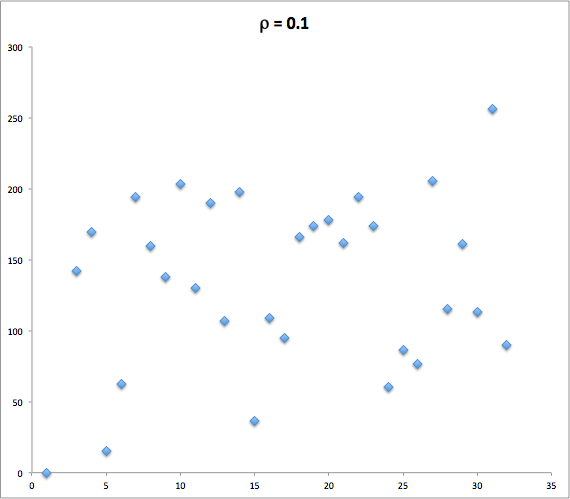
- Zero value
\rho_p(x,y) = 0 relates to absence of correlation between
x and
y (see also Fig. 2)
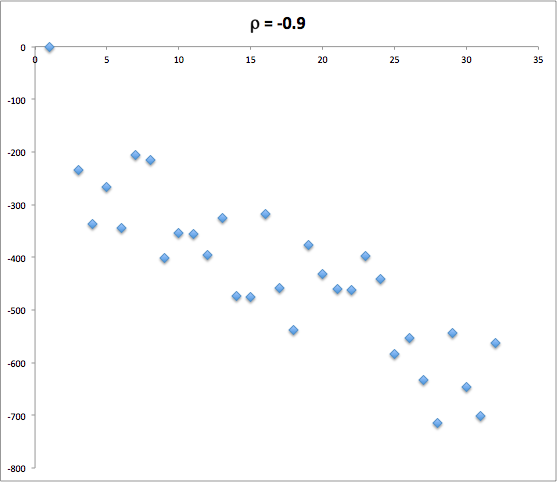
- Minimum value \rho_p(x,y) = - 1 relates to perfect linear correlation with a<0 (also called anti-correlation) (see also Fig. 3)
|
|
|
| Fig. 1. Highly correlated variables | Fig. 2. Poorly correlated variables | Fig. 3. Highly anti-correlated variables |
See also
Natural Science / System / Model / Model Validation
Formal science / Mathematics / Statistics / Statistical correlation / Correlation coefficient
[ Statistical correlation metrics @ review ] [ Spearmen Correlation ] [ Kendall correlation ] [ Fehner correlation ]