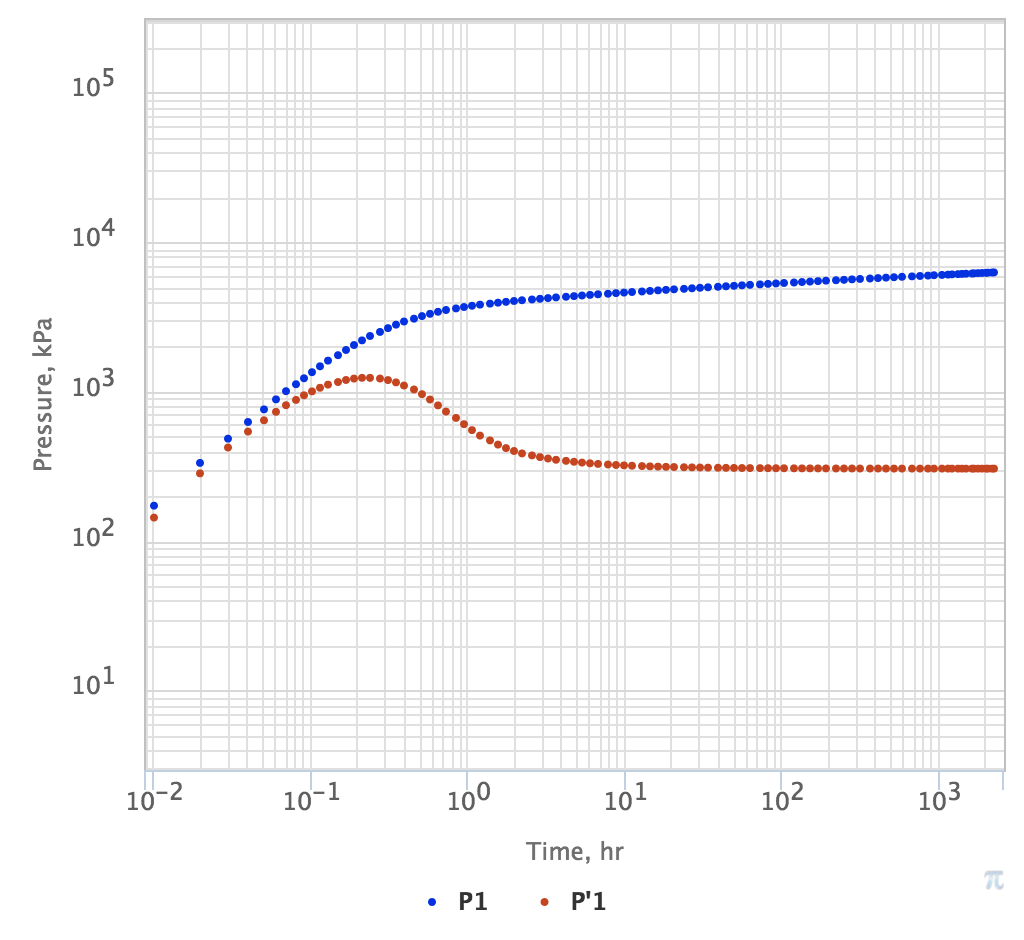
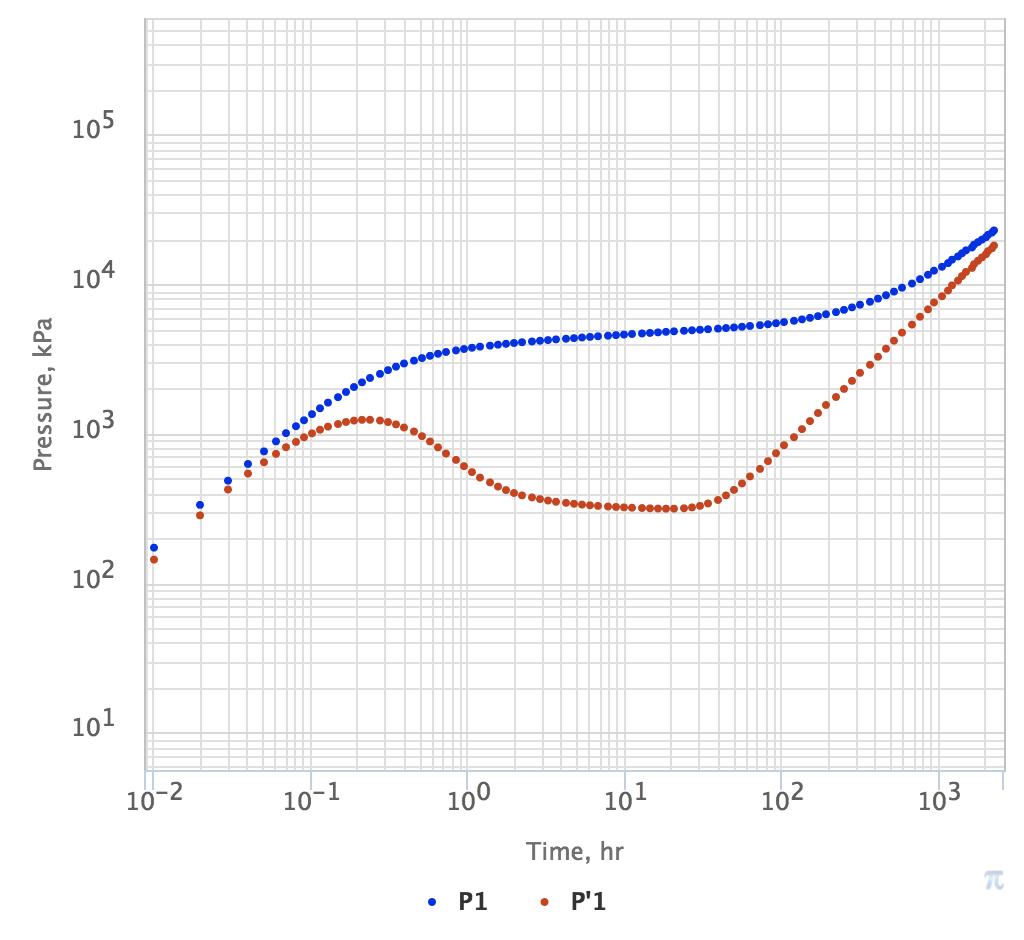
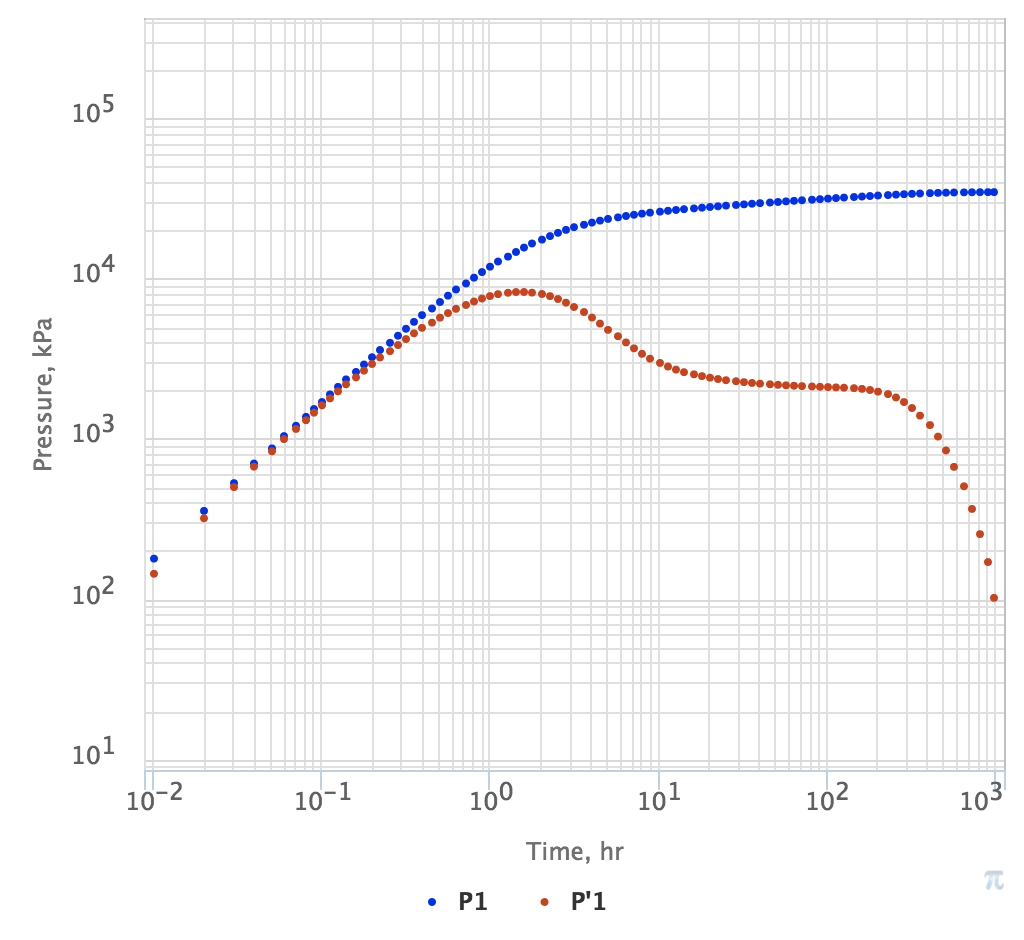
Log-log plot of unit-rate drawdown survey pressure variation \Delta p(t) = p_{wf}(0) - p_{wf}(t) and pressure log-derivative \Delta p'(t) = \frac{d \Delta p}{d \, \ln t} (see Fig. 1 and Fig. 2, for example).
The pressure log-derivative \Delta p'(t) provides a zoomed insight into the pressure diffusion dynamics at different times which helps identifying the pressure diffusion model behind the pressure variation.
See PTA Type Library for a wide range of typical PTA Diagnostic Plots.
|
|
|
Fig. 1. PTA Diagnostic Plot for vertical well in single-layer homogeneous reservoir without boundaries. Pressure is in blue and log-derivative is in red. | Fig. 2. PTA Diagnostic Plot for vertical well in single-layer homogeneous reservoir with impermeable circle boundary. Pressure is in blue and log-derivative is in red. | Fig. 3. PTA Diagnostic Plot for vertical well in single-layer homogeneous reservoir with constant pressure boundary. Pressure is in blue and log-derivative is in red. |