Pressure log-log plot of unit-rate drawdown surveypressure drop
| LaTeX Math Inline | ||
|---|---|---|
|
| LaTeX Math Inline | ||
|---|---|---|
|
Traditionally the pressure drop on pressure log-log plots is denoted by
| LaTeX Math Inline | ||
|---|---|---|
|
| LaTeX Math Inline | ||
|---|---|---|
|
| LaTeX Math Inline | ||
|---|---|---|
|
The pressure log-derivative
| LaTeX Math Inline | ||
|---|---|---|
|
...
|
|
|
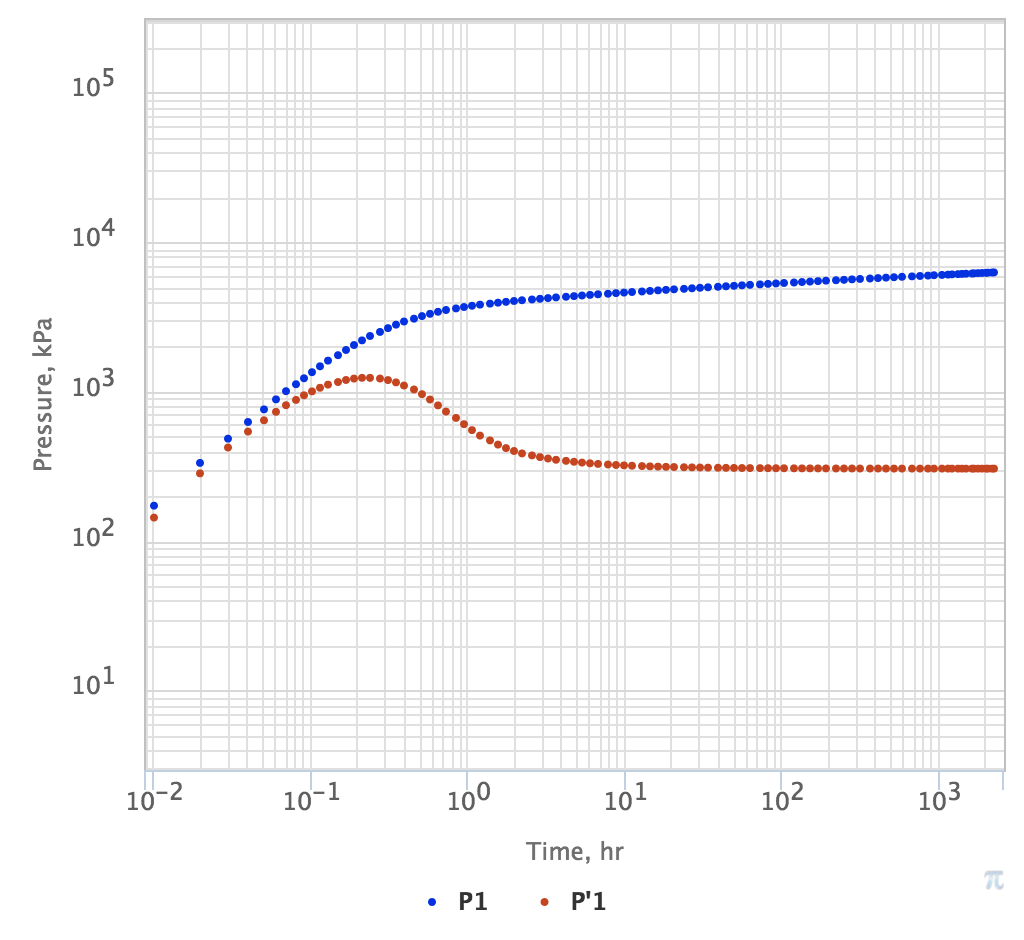
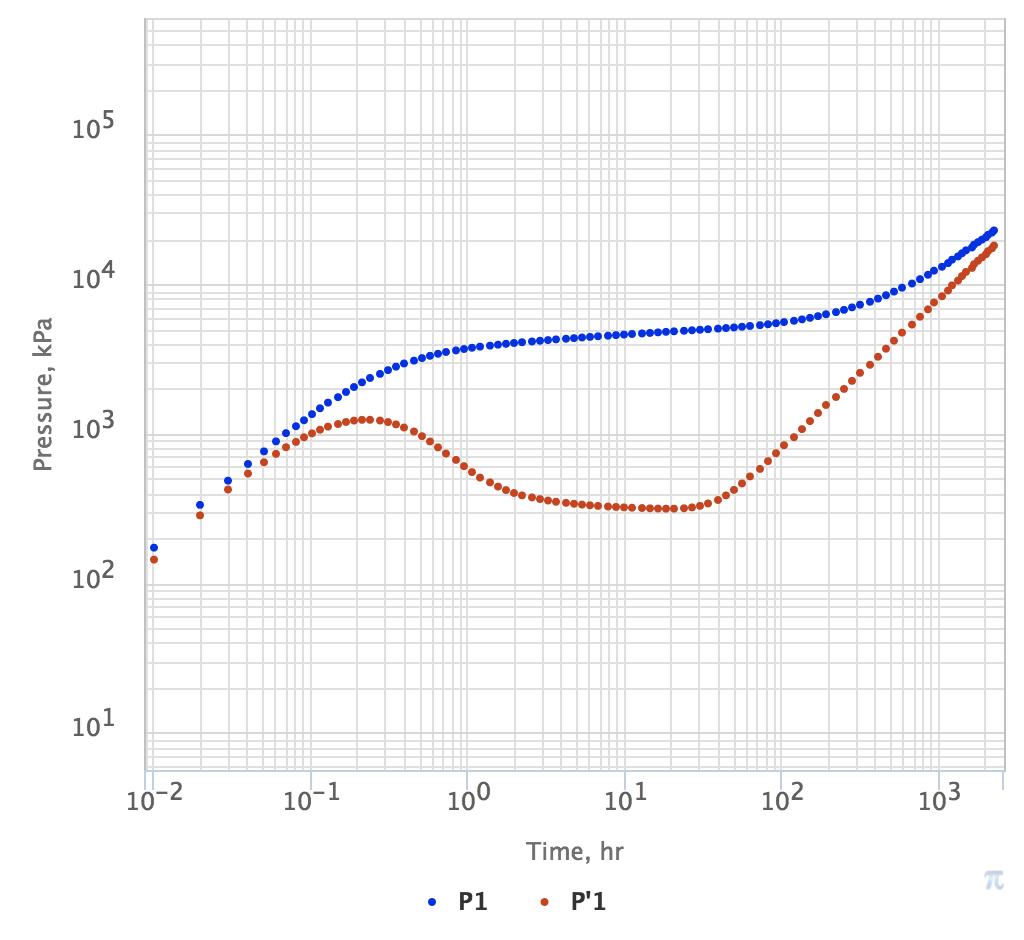
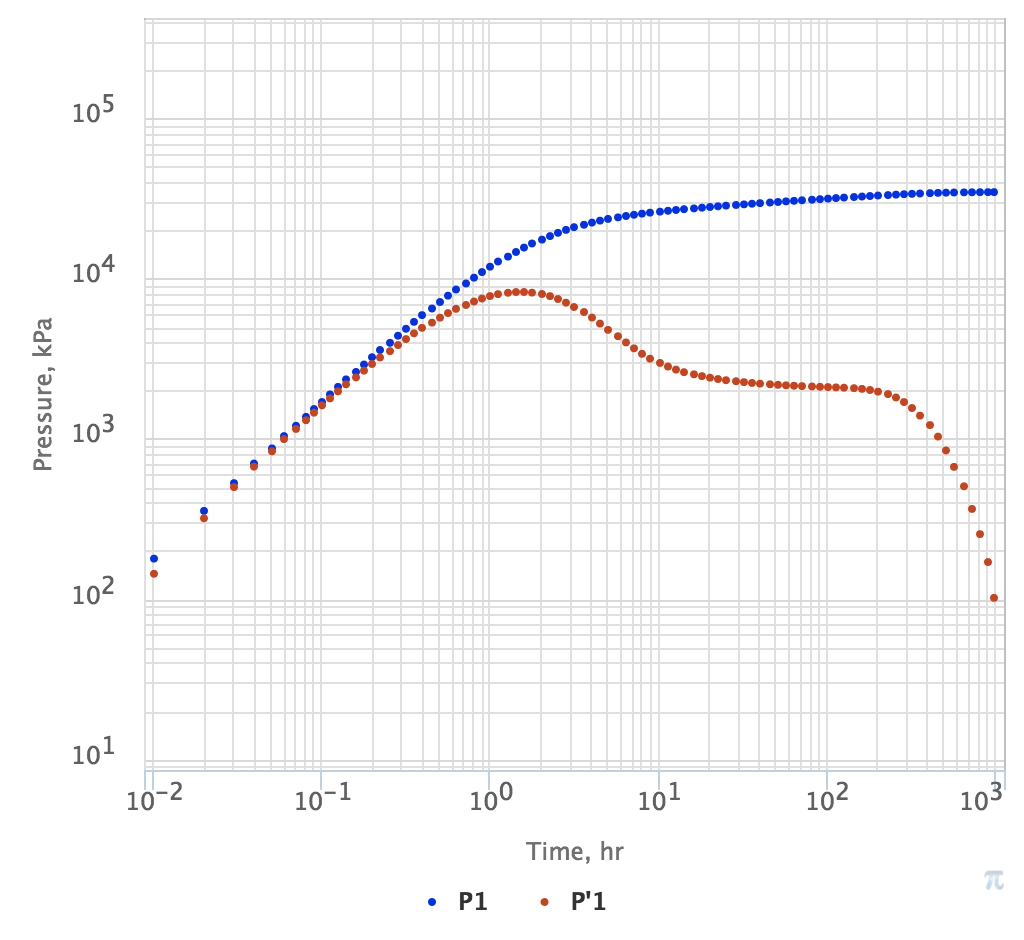
Fig. 1. PTA Diagnostic Plot for vertical well in single-layer homogeneous reservoir without boundaries (IARF). Pressure drop is in blue and log-derivative is in red. | Fig. 2. PTA Diagnostic Plot for vertical well in single-layer homogeneous reservoir with impermeable circle boundary (PSS). Pressure drop is in blue and log-derivative is in red. | Fig. 3. PTA Diagnostic Plot for vertical well in single-layer homogeneous reservoir with constant pressure boundary (SS). Pressure drop is in blue and log-derivative is in red. |
See PTA Type Library for a wide range of typical PTA Diagnostic Plots.
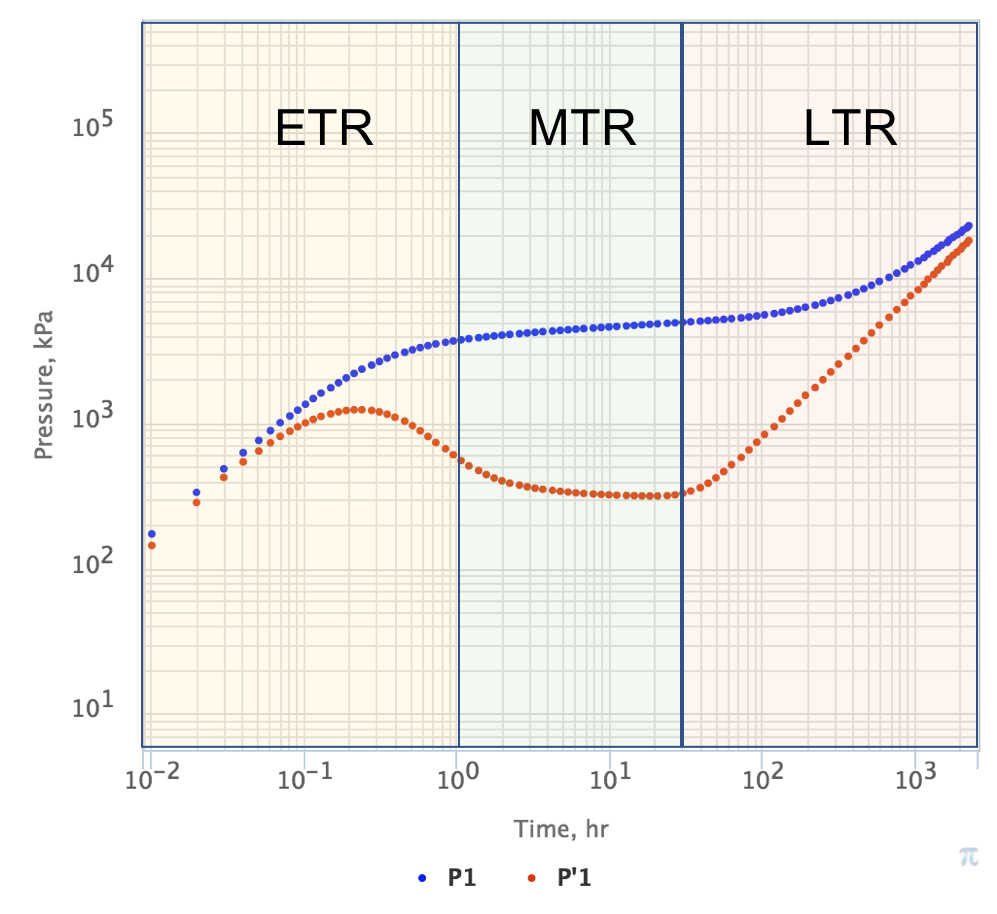
The usual convention is to split pressure transient response in three major time intervals (see also Fig. 4):
| Early Time Response (ETR) | Middle Time Response (MTR) | Late Time Response (LTR) |
|---|---|---|
| Wellbore storage and well-reservoir contact effects | Unconstrained reservoir flow | Reservoir boundary effects |
|
Fig. 4. PTA Diagnostic Plot with ETR, MTR and LTR time zones. Pressure drop is in blue and log-derivative is in red. |
See Also
...
Petroleum Industry / Upstream / Subsurface E&P Disciplines / Well Testing / Pressure Testing / Pressure Transient Analysis (PTA)
[ Well & Reservoir Surveillance ] [ Pressure Diffusion ] [ PTA Type Library ]