...
 | |
| Fig. 1. Well locations with current production bubble map over the structural map | Fig. 2.Production / Injection history |
| Fig. 3. | Fig. 4. |
| Fig.5. | Fig. 6. |
| Fig. 7. | Fig. 8. |
| Fig. 9. | Fig. 10. |
|
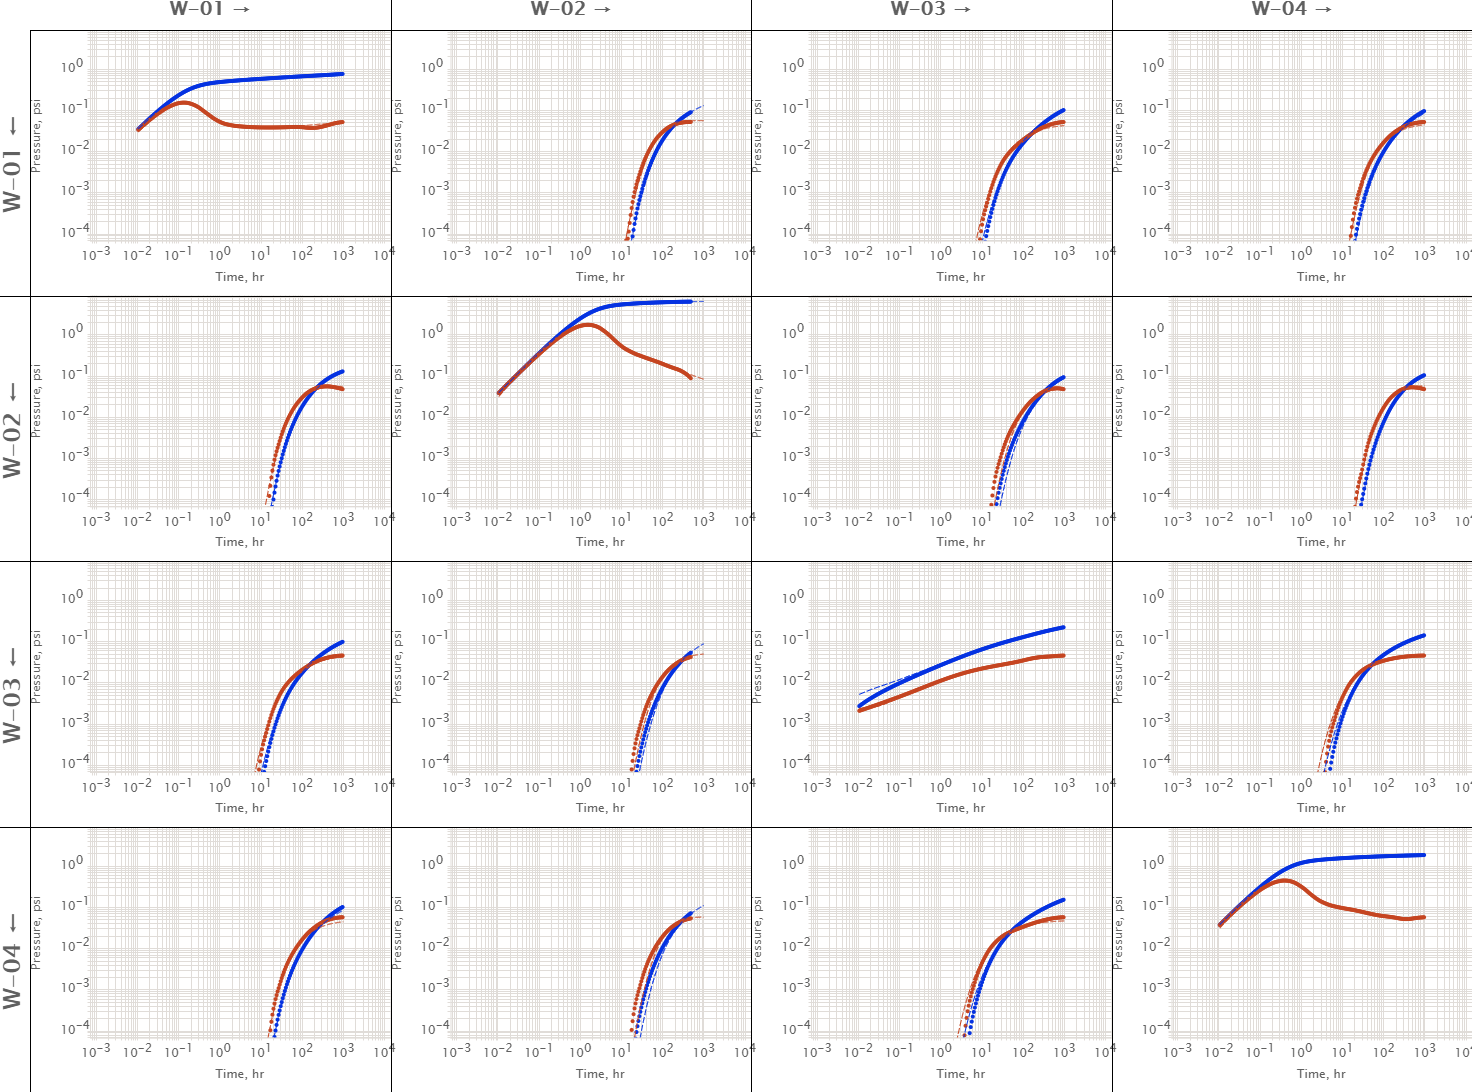
Fig. 3. UTR output diagram from MDCV which is a key element of MRT. The column wells showing pressure response to row wells. Diagonal elements are showing self-response DTRs. Non-diagonal elements showing cross-well response CTRs. |
...