...
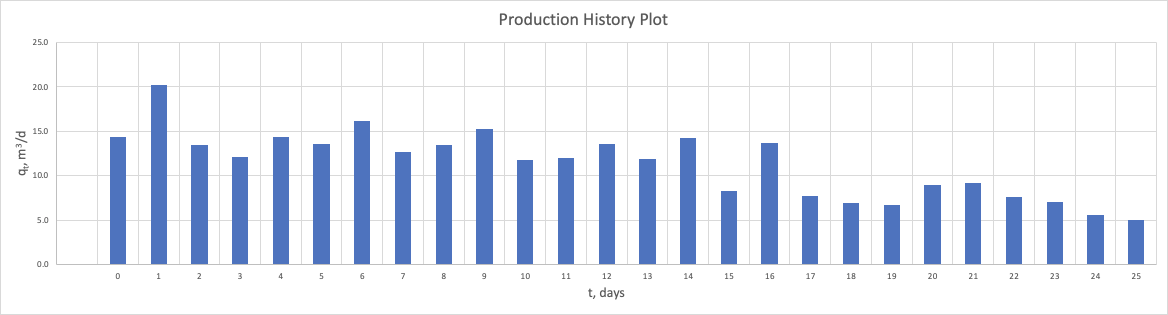
Sample #3 – Declining production
| ||
| Fig. 3.1. Production History plot | ||
|
|
|
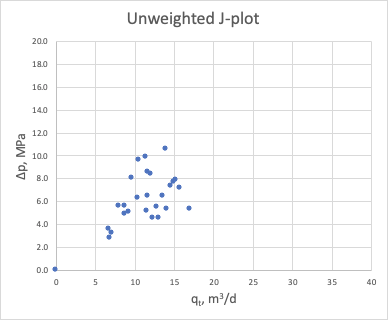
| Fig. 3.2. Unweighted J-plot | Fig. 3.3. t-weighted J-plot | Fig. 3.4. q-weighted J-plot |
|
| |
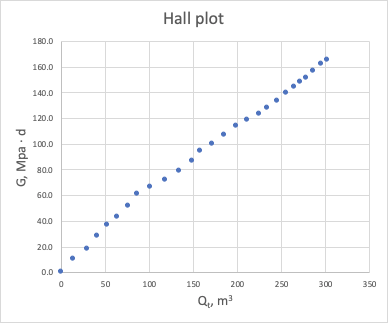
| Fig. 3.5. Inflow Performance Relationship (IPR) | Fig. 3.6. Hall Plot | |


See Also
...
Petroleum Industry / Upstream / Production / Subsurface Production / Field Study & Modelling / Production Analysis / Productivity Diagnostics
...