changes.mady.by.user Arthur Aslanyan (Nafta College)
Saved on Jan 24, 2019
...
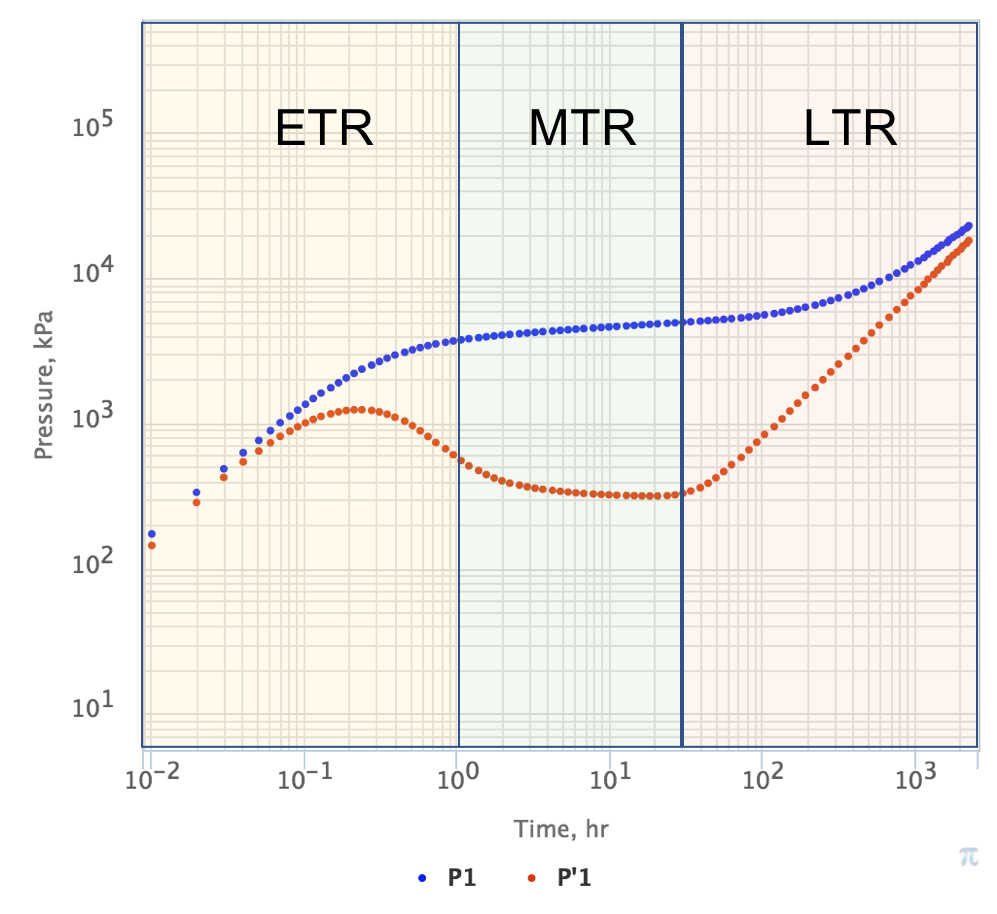
Fig. 4. PTA Diagnostic Plot with ETR, MTR and LTR time zones.
Pressure drop is in blue and log-derivative is in red.