The plot of water production rateof WOR (along y-axis) against the inverse oil production rate (along x-axis) (see Fig. 1).
 Image Removed Image Removed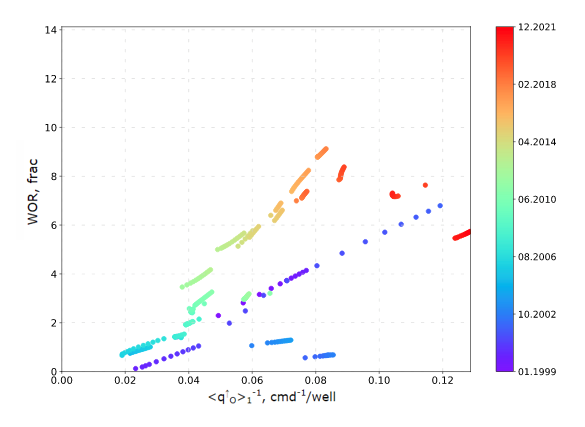 Image Added Image Added
|
| Fig. 1. WOR (logarithmic vertical axis) vs inverse inverse oil production rate (linear horizontal axis) |
...
| LaTeX Math Block |
|---|
| WOR = \frac{q_W/}{q_O} = a + b \, / \, qcdot q^{-1}_O |
| | LaTeX Math Block |
|---|
| a = J^{-1}_{1O} \cdot ( J_{1W} + J_{2W}) |
| | LaTeX Math Block |
|---|
| b = J_{2W} \cdot (p^*_2 - p^*_1) |
|
...
| LaTeX Math Block |
|---|
|
<WOR>\langle WOR \rangle =\frac{\langle <q_W>/<q_O>q_W \rangle}{\langle q_O \rangle} = a + b \cdot \,langle /<q_O>q_O^{-1} \rangle |
where
| LaTeX Math Inline |
|---|
| body | <q_W>, \ <q_O>\langle q_W \rangle, \ \langle q_O \rangle |
|---|
|
| are weighted average of and |
...
| |
|---|
| LaTeX Math Block |
|---|
| <\langle A >\rangle_t \ = \frac{1}{t} \int_o^t A(t) \, dt |
| | LaTeX Math Block |
|---|
| <A>\langle A\rangle_q \ = \frac{1}{Q(t)} \int_o^t A(t) \, q(t) \, dt |
|
See Also
...
Petroleum Industry / Upstream / Production / Subsurface Production / Field Study & Modelling / Production Analysis / Watercut Diagnostics
References
...
Chan, K. S. (1995, January 1). Water Control Diagnostic Plots. Society of Petroleum Engineers. doi:10.2118/30775-MS
...