...
| LaTeX Math Block | ||||
|---|---|---|---|---|
| ||||
p_{wf} = p_{wf}(q) |
...
|
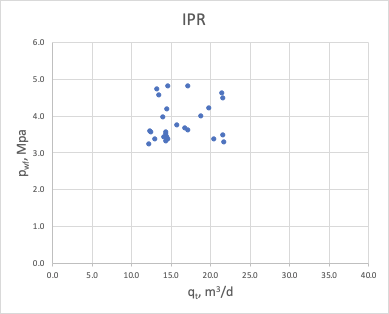
| Fig. 1 |
...
One of the two key concepts of Well Flow Performance analysis along with Vertical Lift Performance (VLP).
...
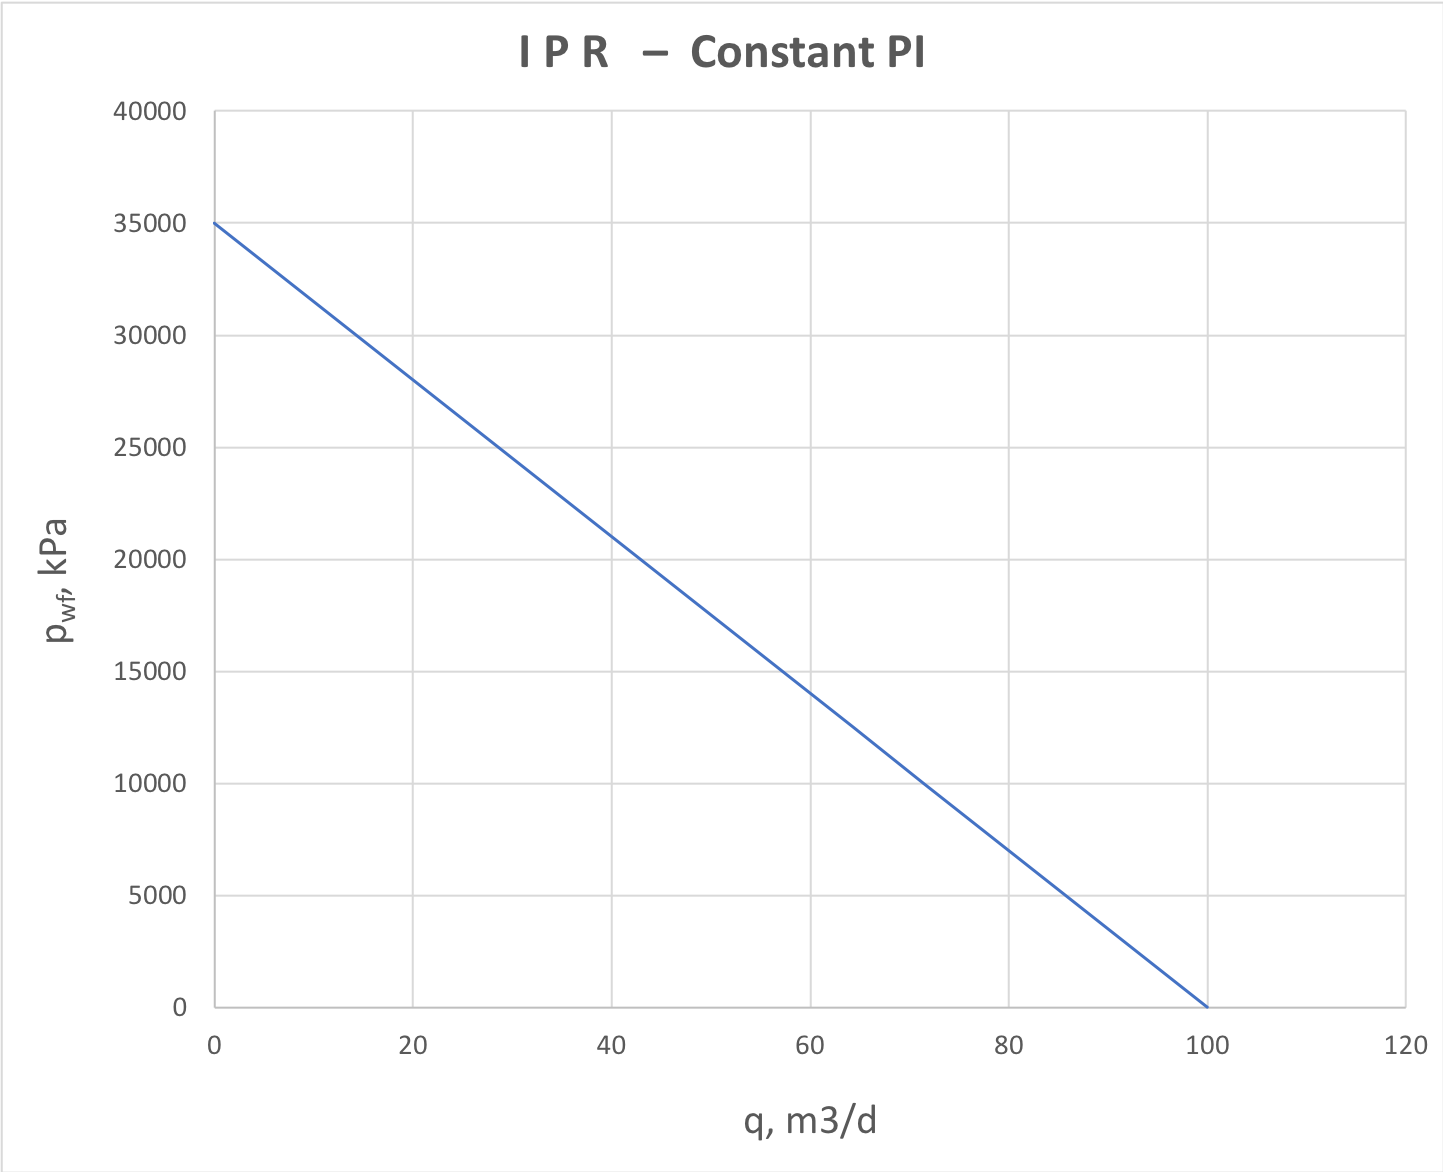
The Productivity Index can be constant (showing a straight line on IPR like on Fig. 12) or dependent on bottomhole pressure
| LaTeX Math Inline | ||
|---|---|---|
|
| LaTeX Math Inline | ||
|---|---|---|
|
In general case of multiphase flow the PI
| LaTeX Math Inline | ||
|---|---|---|
|
| LaTeX Math Inline | ||
|---|---|---|
|
| LaTeX Math Inline | ||
|---|---|---|
|
...
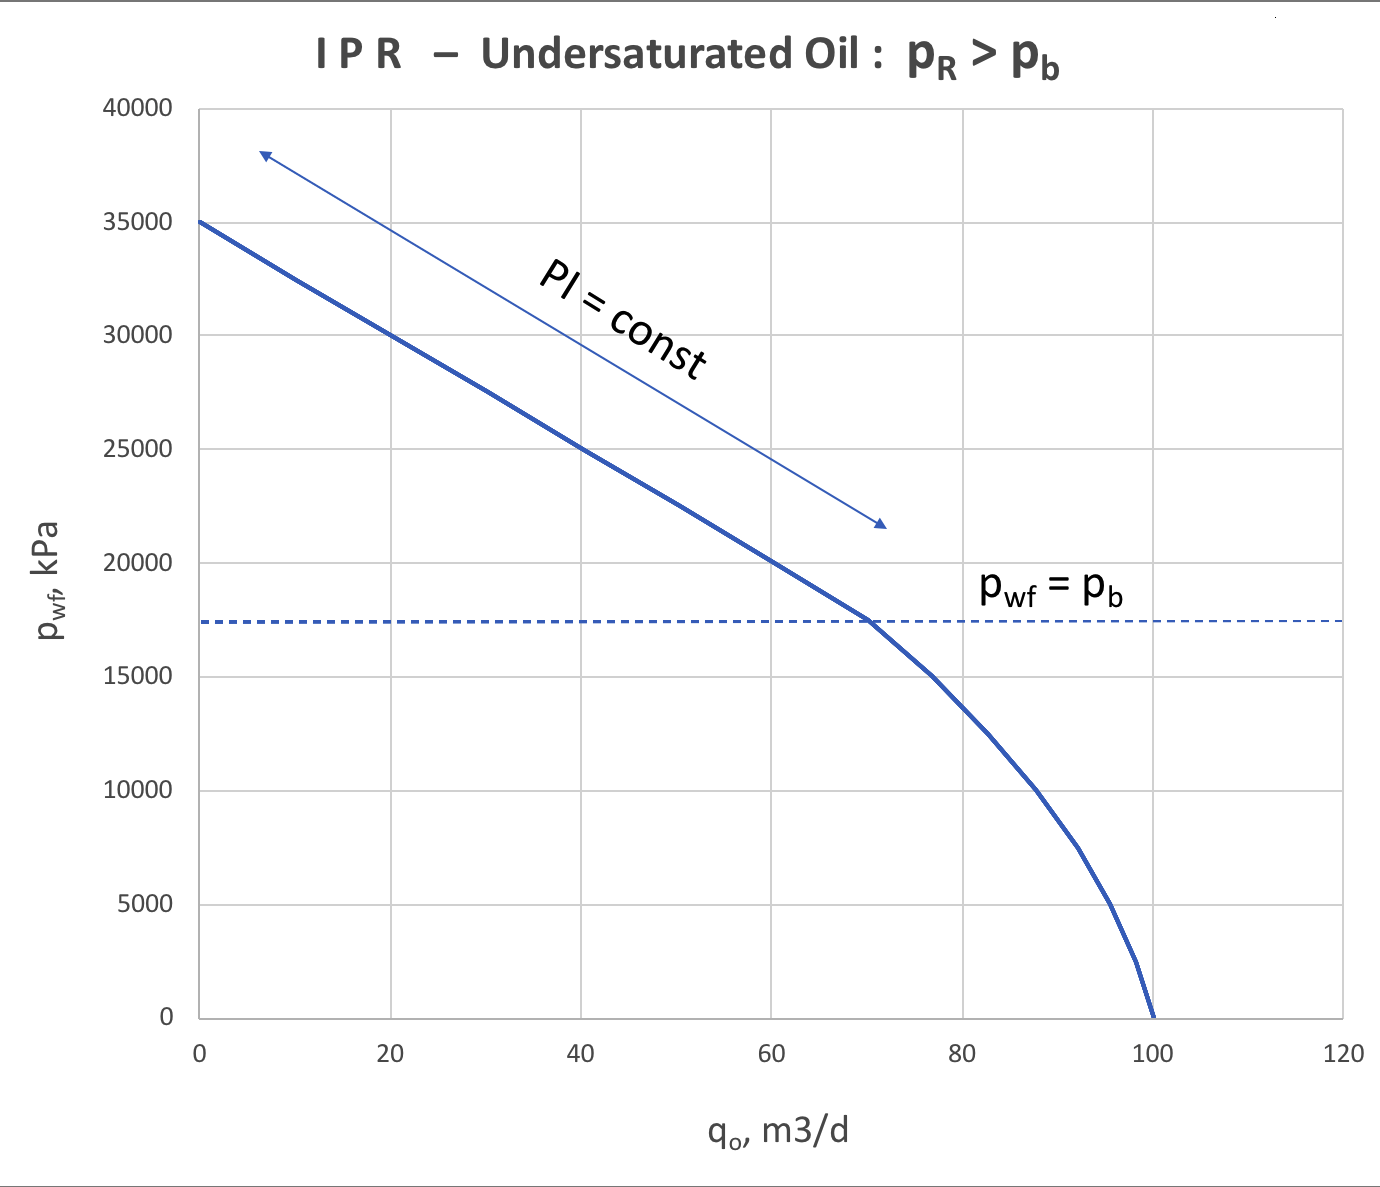
For a single layer formation with low-compressibility fluid (water or dead oil) the PI does not depend on drawdown (or flowrate)
| LaTeX Math Inline | ||
|---|---|---|
|
|
| Fig. 12. IPR plot for constant productivity (water and dead oil) |
...
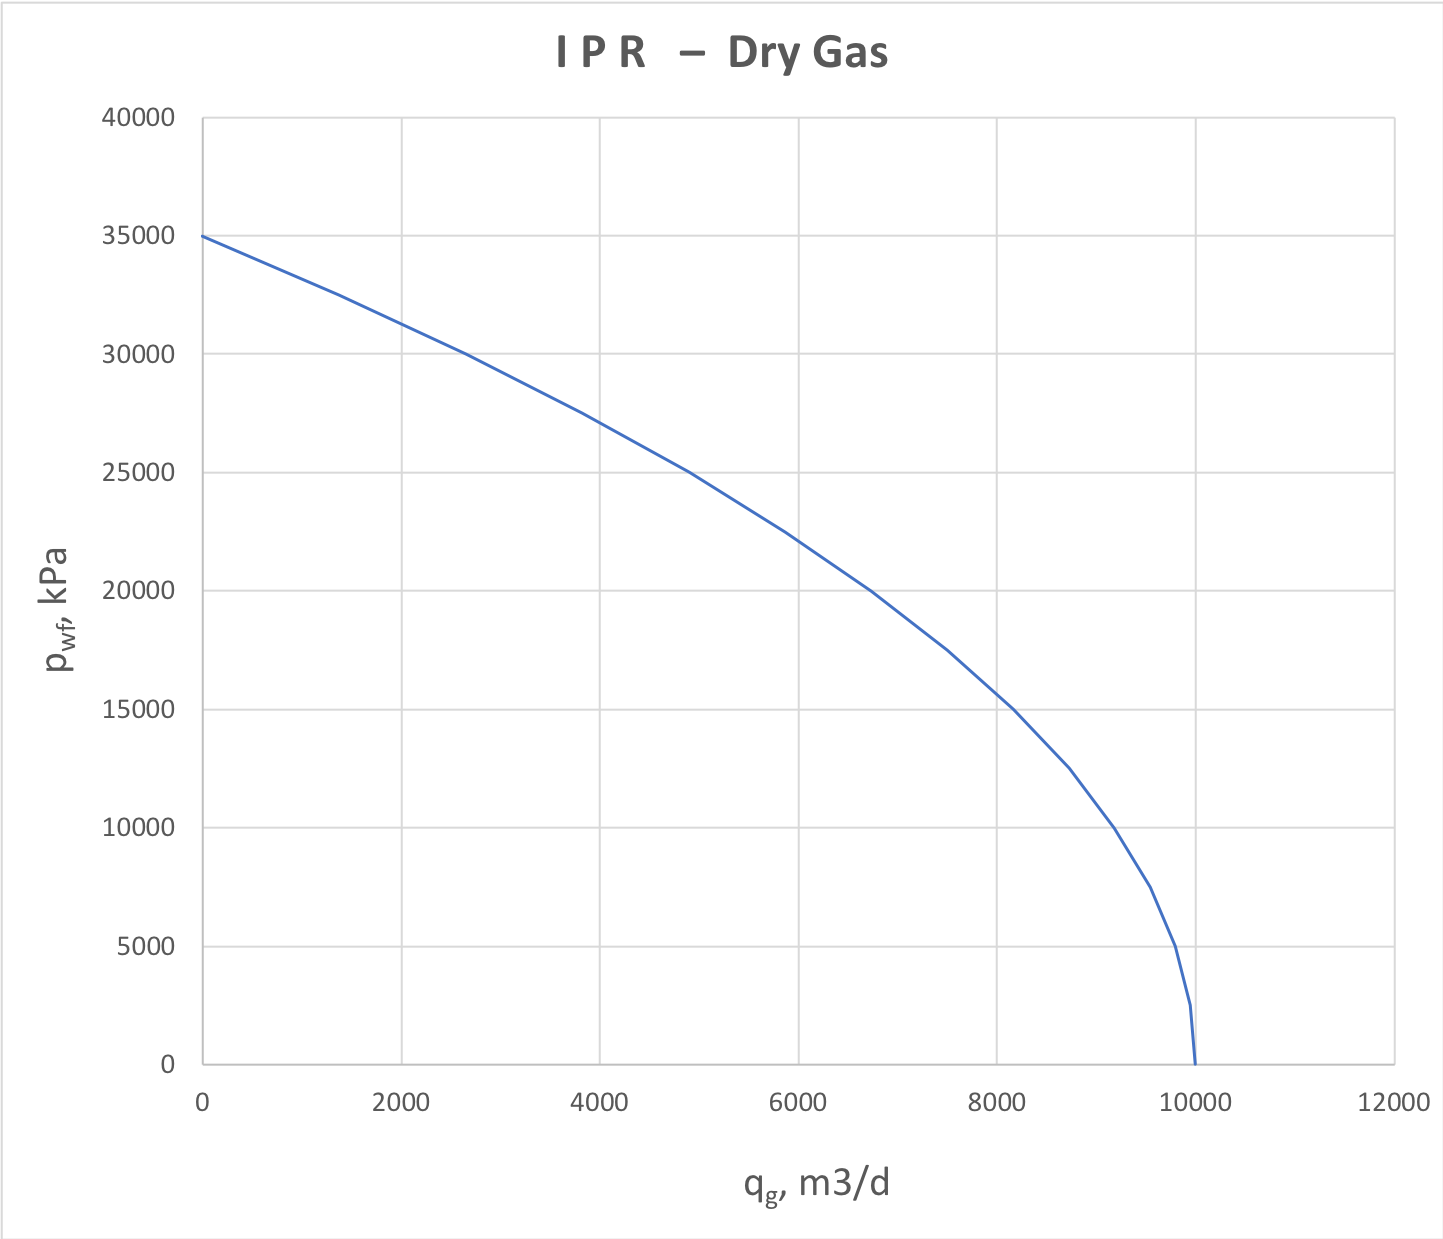
For gas producers, the fluid compressibility is high and formation flow is essentially non-linear, inflicting the downward trend on the whole IPR plot (Fig. 23).
|
Fig. 23. IPR for dry gas producer or gas injector into a gas formation |
...
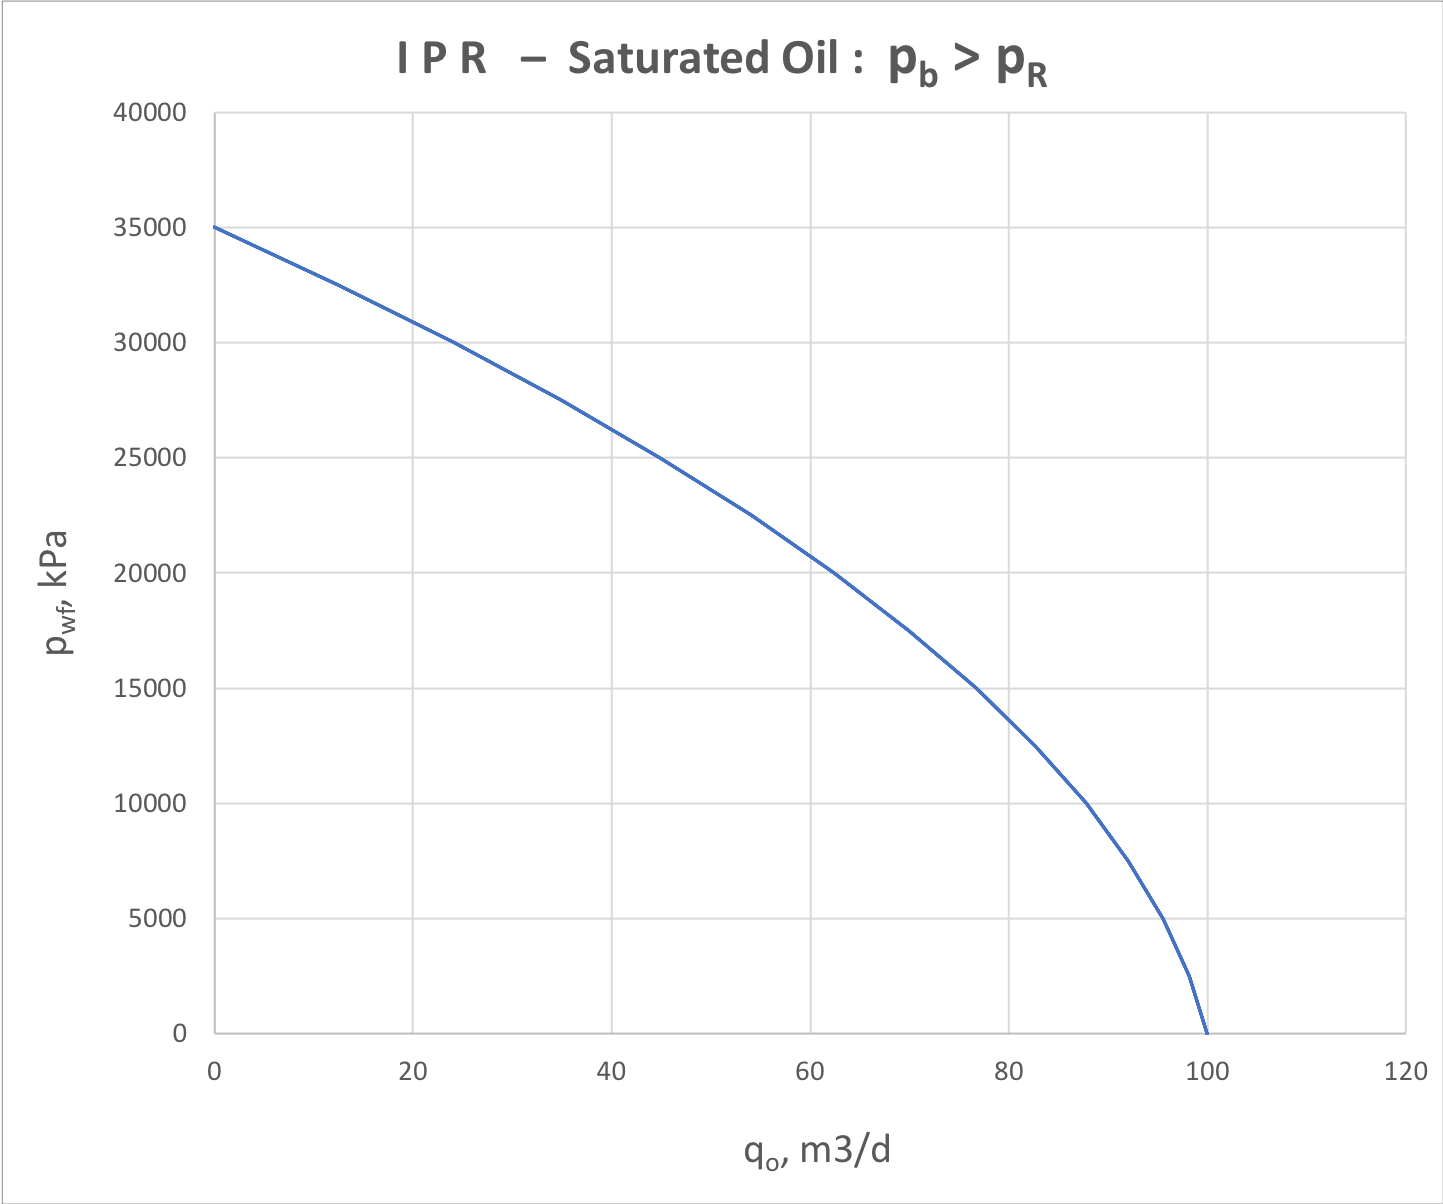
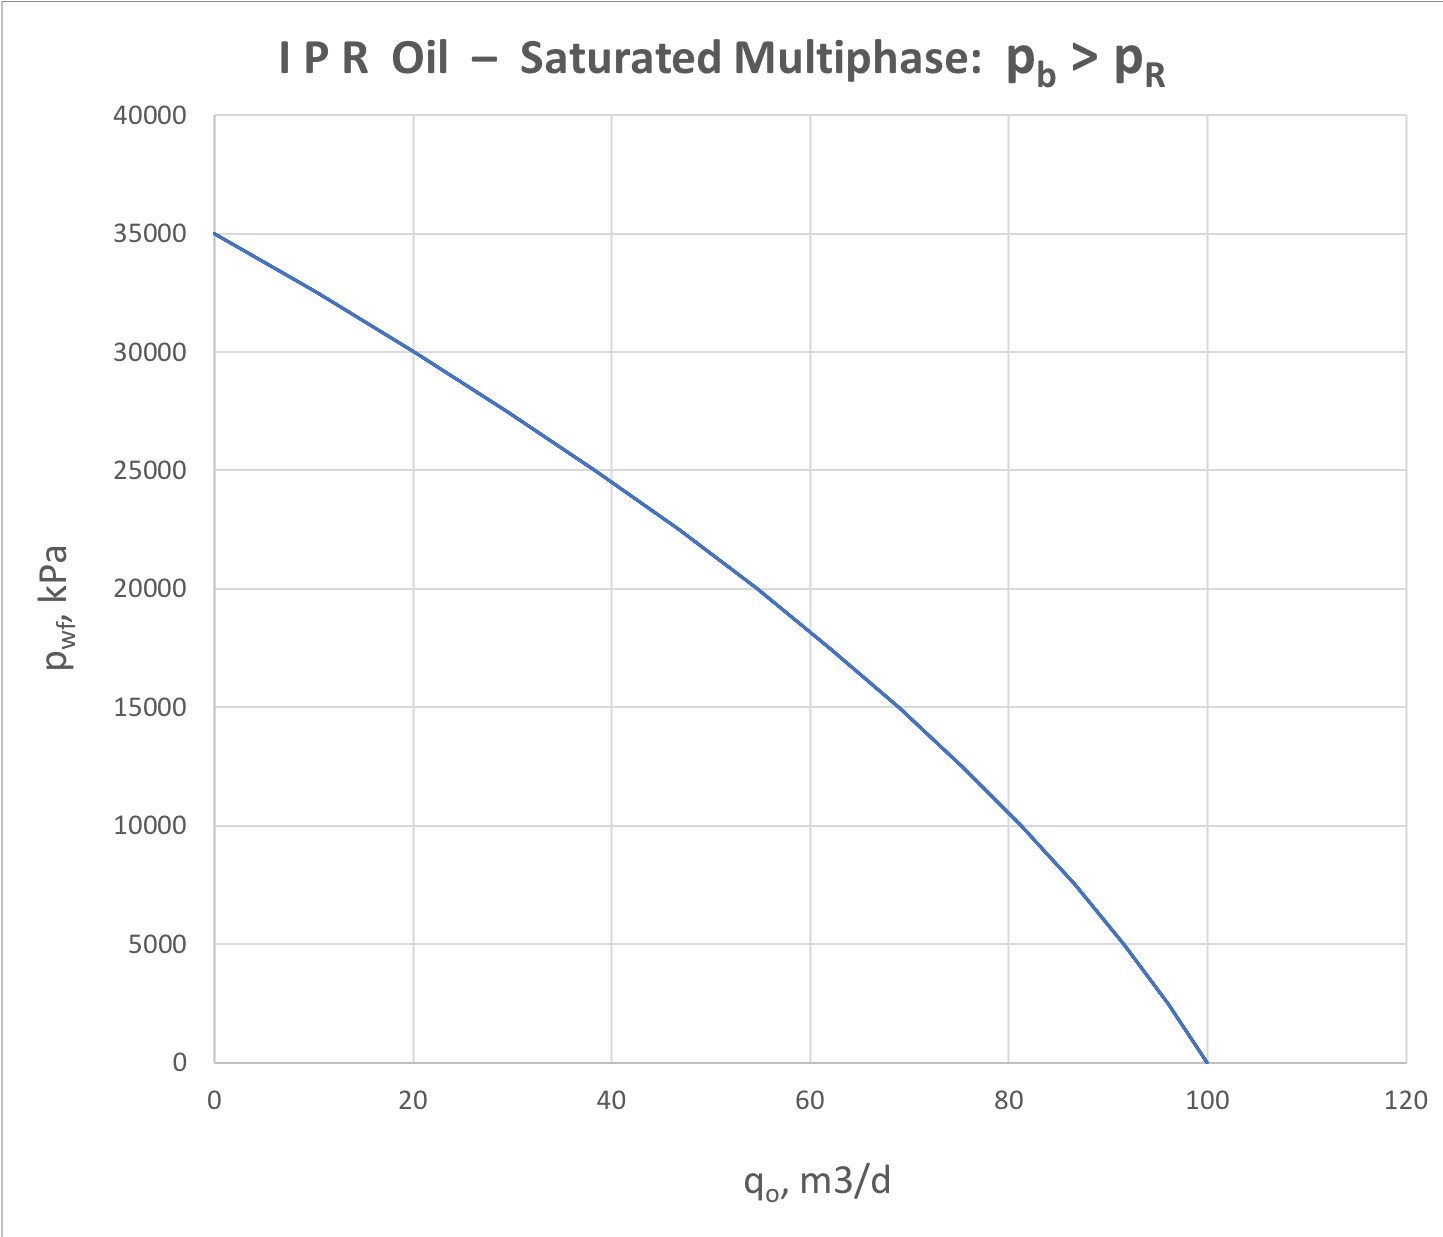
For saturated oil reservoir the free gas flow inflict the downward trend of IPR plot similar to dry gas (Fig. 34).
|
Fig. 34. IPR for 2-phase oil+gas production below and above bubble point |
...
When bottom-hole pressure goes below bubble point
| LaTeX Math Inline | ||
|---|---|---|
|
It can be interpreted as deterioration of near-reservoir zone permeability when the fluid velocity is high and approximated by rate-dependant skin-factor.
|
Fig. 35. IPR for 2-phase oil+gas production below and above bubble point |
...
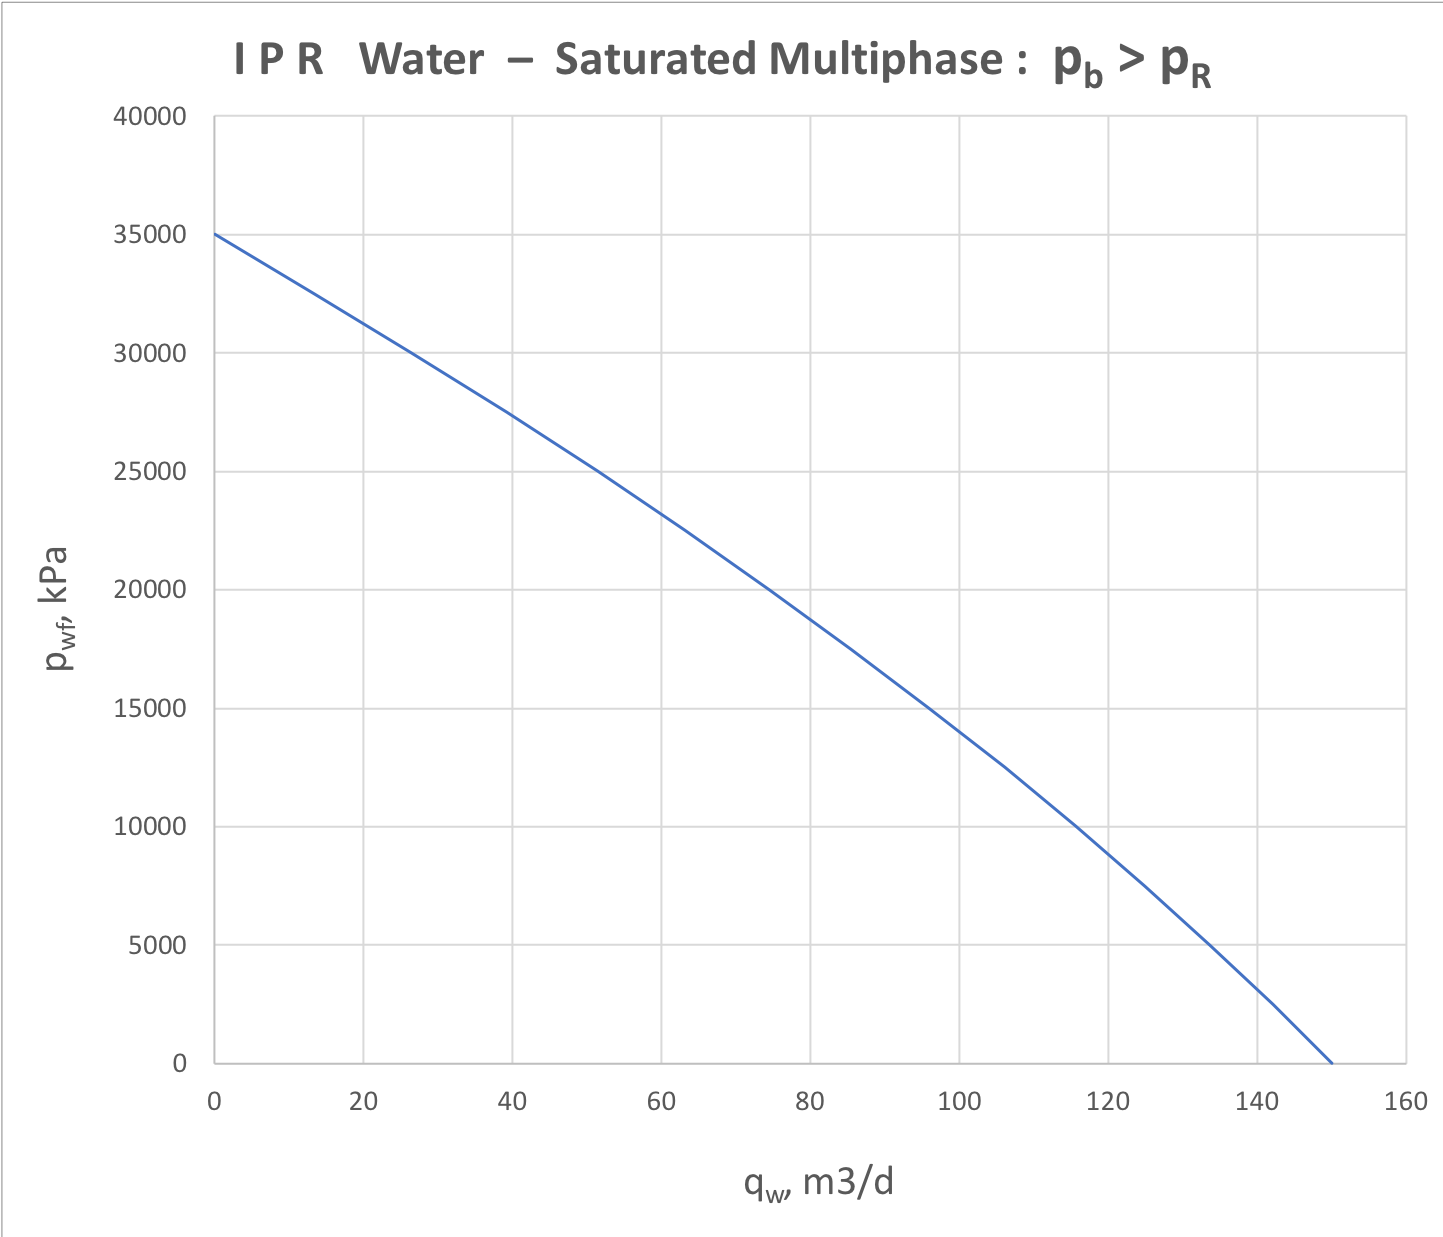
For saturated 3-phase water-oil-gas reservoir the IPR analysis is represented by oil and water components separately (see Fig. 46.1 and Fig. 46.2).
|
|
Fig. 46.1. Oil IPR for saturated 3-phase (water + oil + gas) formation flow | Fig. 46.2. Water IPR for saturated 3-phase (water + oil + gas) formation flow |
...
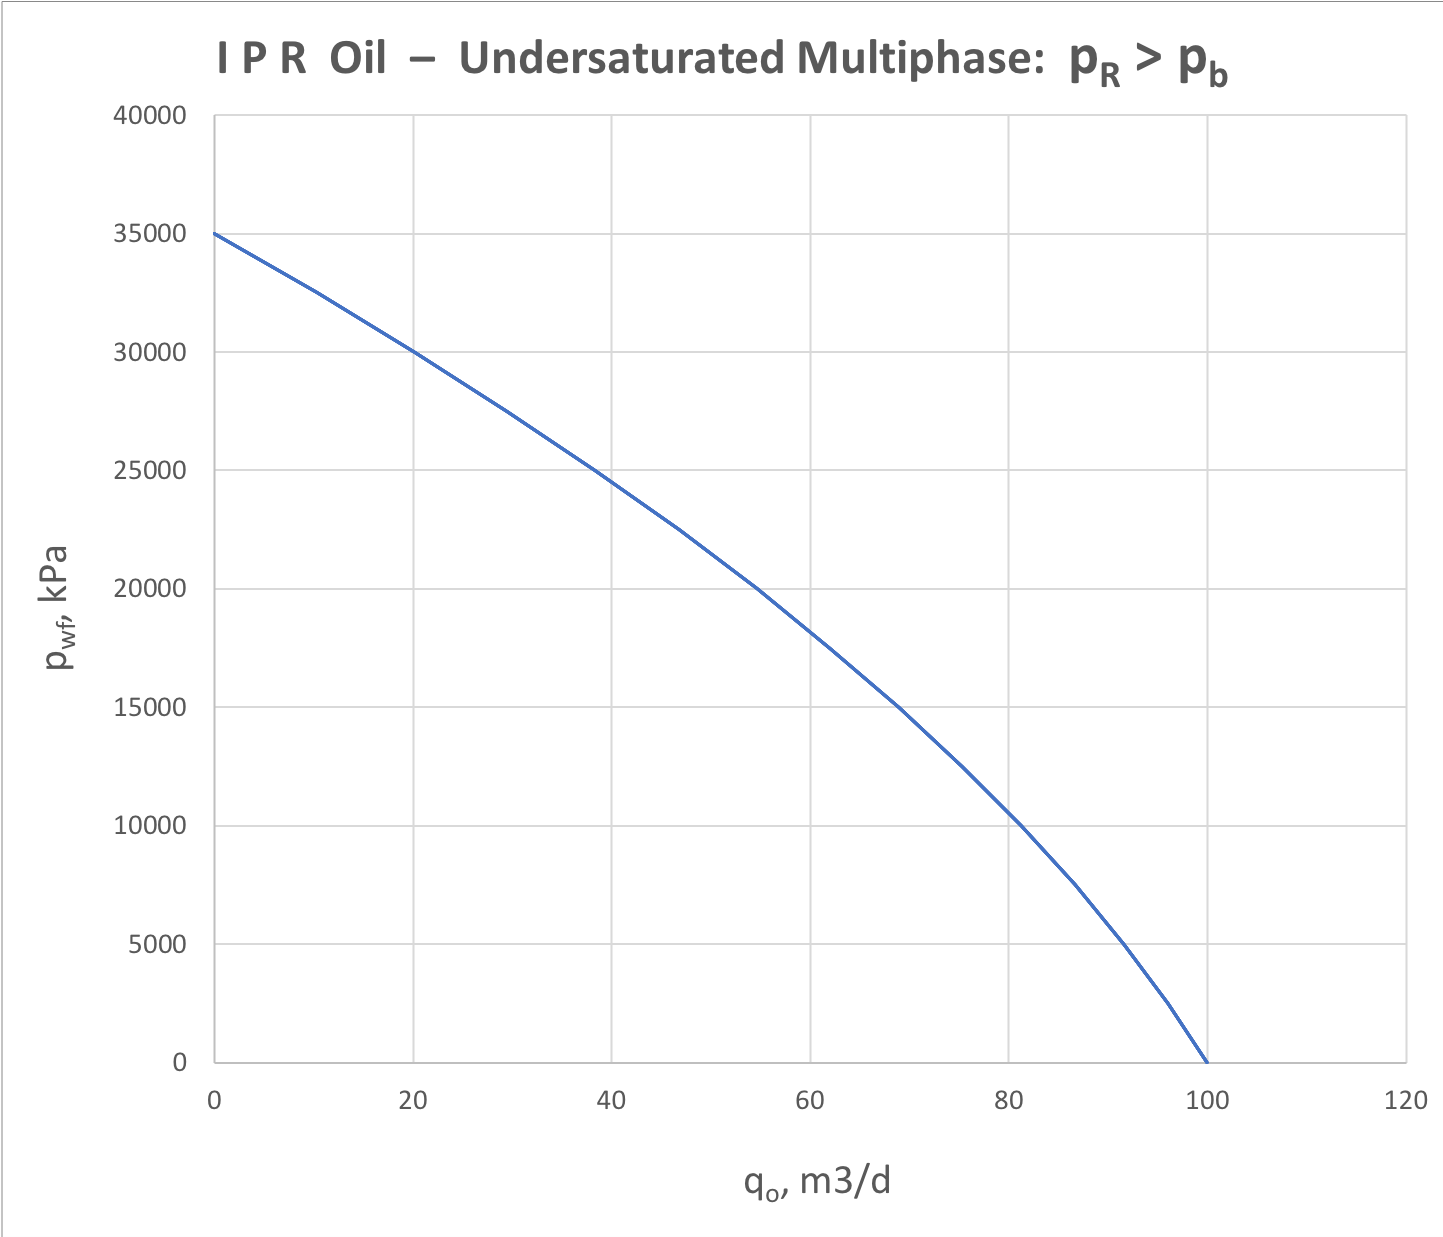
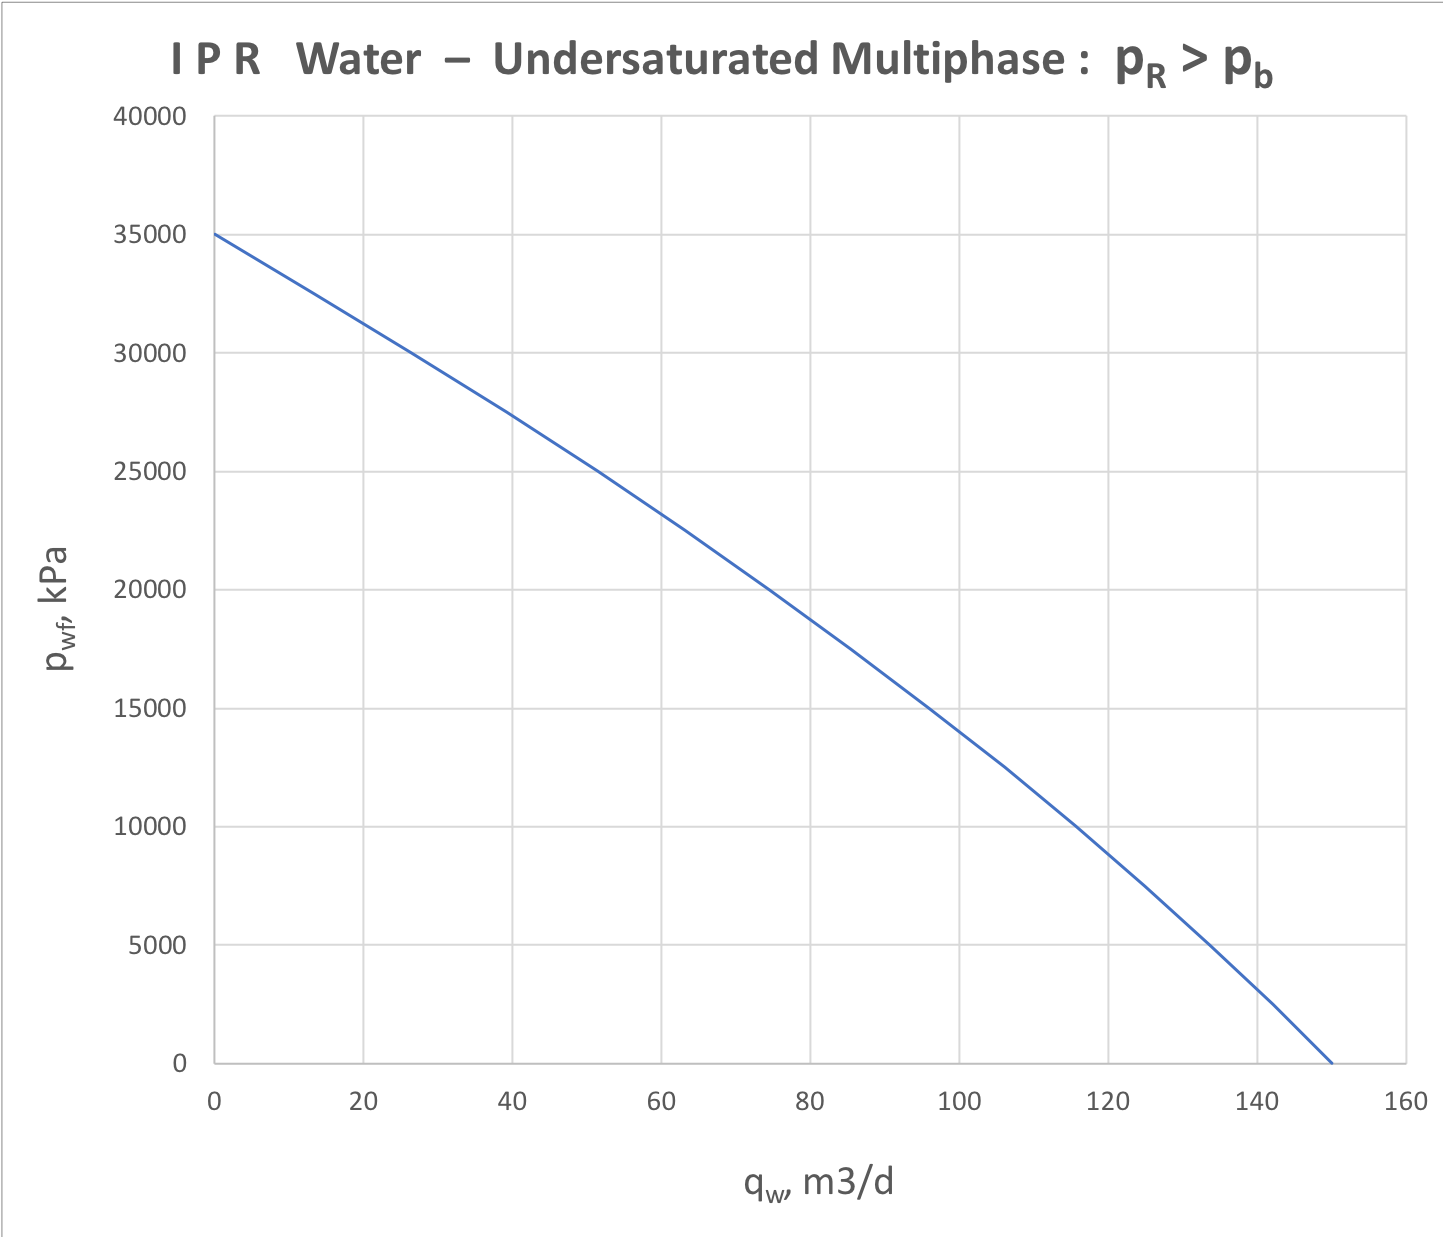
For undersaturated 3-phase water-oil-gas reservoir the IPR analysis is represented by oil and water components separately (see Fig. 47.1 and Fig. 47.2).
|
|
Fig. 47.1. Oil IPR for udersaturated 3-phase (water + oil + gas) formation flow | Fig. 47.2. Water IPR for undersaturated 3-phase (water + oil + gas) formation flow |
...