Lift Curves (LC) = Tubing Performance Relation (TPR) = Vertical Lift Performance (VLP) = Vertical Flow Performance (VFP)
Represents the relation between the bottom-hole pressure p_{wf} and surface flow rate q during the stabilised wellbore flow under a constant Tubing Head Pressure (THP) p_s:
| (1) | p_{wf} = p_{wf}(q) |
which also depends on GOR and Yw.
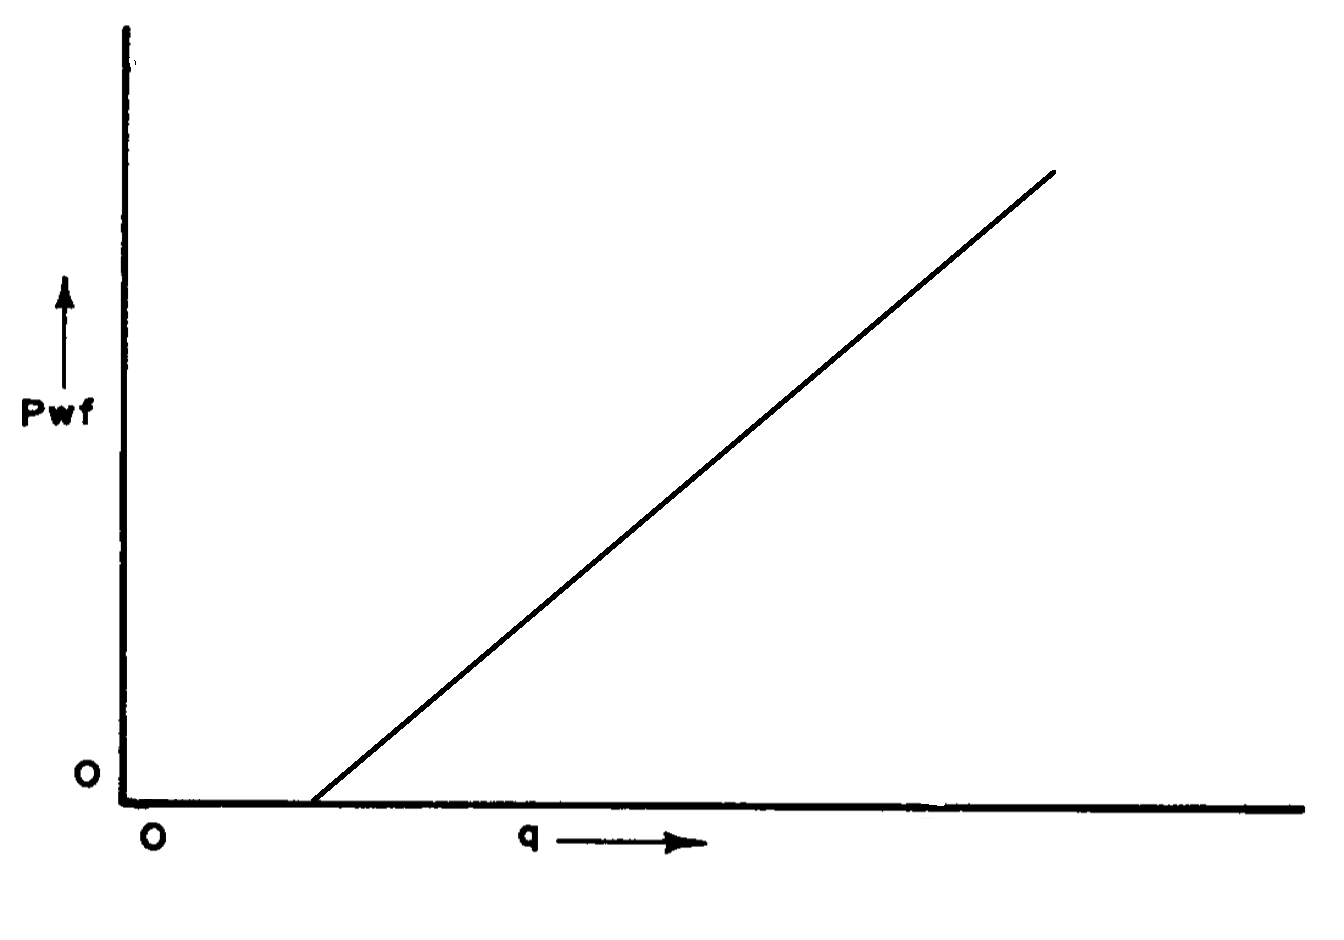
The example of Lift Curves (LC) for single-phase fluid flow is shown on Fig. 1.1 (low-compressible) and Fig. 1.2 (high compressible).
|
|
| Fig 1.1. Lift Curves for low-compressible fluid (for example, water) | Fig 1.2. Lift Curves for high-compressible fluid (for example, gas) |
The example of Lift Curves (LC) for dual-phase fluid flow shown on Fig. 2.
|
|
|
| Fig 2.2. Lift Curves for 2-phase Oil + Gas flow | Fig 2.2. Lift Curves for 2-phase Oil + Water flow | Fig 2.3. Lift Curves for 2-phase Gas + Water flow |
The examples of Lift Curves (LC) for 3-phase Oil + Gas + Water flow at various watercuts ( Y_w = \{ 20 \%, \, 50 \%, \, 80 \% \}) are shown on Fig. 3.
|
|
|
Fig 3.1. Lift Curves for 3-phase Oil + Gas + Water flow at Y_w = 20 \% | Fig 3.2. Lift Curves for 3-phase Oil + Gas + Water flow at Y_w = 50 \% | Fig 3.3. Lift Curves for 3-phase Oil + Gas + Water flow at Y_w = 80 \% |
Mathematical Model
See Also
Petroleum Industry / Upstream / Subsurface E&P Disciplines / Production Technology / Well Flow Performance
[ Water Injection Wellbore Profile @model ]
[ Inflow Performance Relation (IPR) ]