...
|
Approximations
...
| |||||||
|---|---|---|---|---|---|---|---|
|
Diagnostic Plots
...
| Pressure Drop |
| |||||||
| Log derivative |
| ||||||||
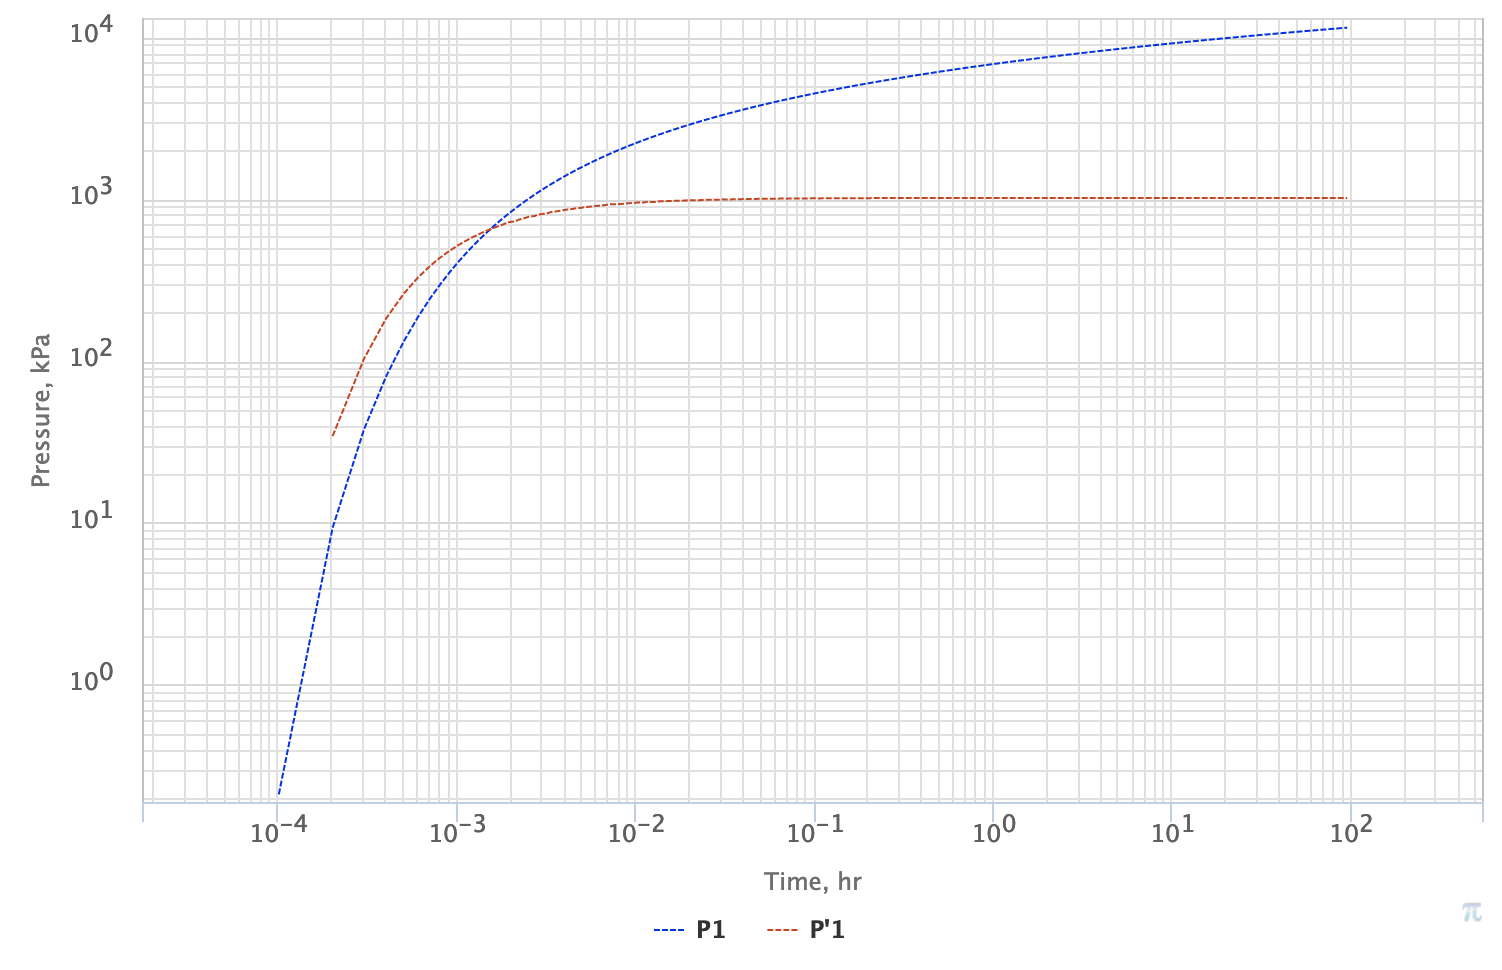
Fig. 1. PTA Diagnostic Plot for LSS pressure response for the 0.1 md reservoir in a close line source vicinity (0.1 m), which is about a typical wellbore size. One can easily see that with wellbore effects neglected even for a very low permeability reservoir the IARF regime is getting formed very early at 0.01 hr (36 s). | |||||||||
...