A list of all Well Intervention activities on a given well.
|
| Fig. 1. W-14 Well Intervention History |
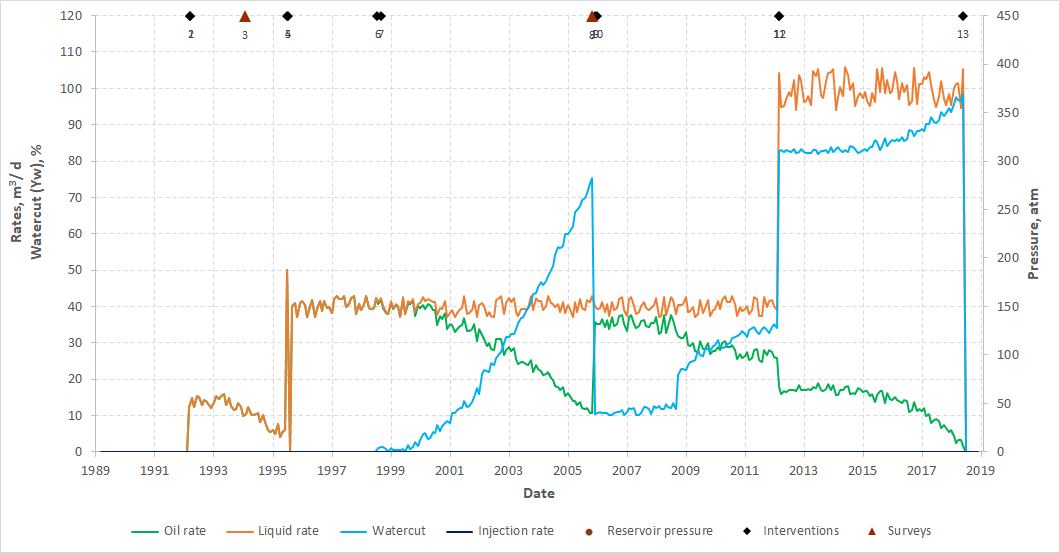
Table 1. W-14 Well Intervention History
| Date | Flow Status | Intervention | Desciption | |
|---|---|---|---|---|
| 1 | 16.03.1992 | Qo = 0 m3/d | Perforation | [ 2344.6-2347.2 ], [ 2354.4-2370.0 ] |
| 2 | 17.03.1992 | Qo = 14 m3/d | Put on stream | Natural lift with 14 m3/d, no water |
| 3 | 17.01.1994 | Qo = 20 m3/d | PLT | Check for inflow profile |
| 4 | 01.07.1995 | Qo = 0 m3/d | Workover | Change of lift: Natural → ESP |
| 5 | 04.07.1995 | Qo = 50 m3/d | Put on stream | ESP50 lift with 50 m3/d, no water |
| 6 | 20.07.1998 | Qo = 0 m3/d | Shut-in | Pump failure |
| 7 | 01.09.1998 | Qo = 40 m3/d | Put on stream | ESP50 lift with 40 m3/d, no water |
| 8 | 01.11.2005 | Qo = 35 m3/d | PLT | Check for water source, Yw = 75 % |
| 9 | 10.12.2005 | Qo = 0 m3/d | Workover | Water shut-off interval [ 2354.4-2370.0 ] Add Perforation [ 2341.5-2343.3 ] |
| 10 | 25.12.2005 | Qo = 40 m3/d | Put on stream | ESP50 lift with 40 m3/d, Yw = 10 % |
| 11 | 04.03.2012 | Qo = 0 m3/d | Workover | Change of lift: ESP50 → ESP100 |
| 12 | 06.03.2012 | Qo = 100 m3/d | Put on stream | ESP100 lift with 100 m3/d, Yw = 82 % |
| 13 | 01.06.2018 | Qo = 0 m3/d | Shut-in | High Yw >= 98 % |
See Also
Petroleum Industry / Upstream / Production / Subsurface Production / Well & Reservoir Management / Well Intervention