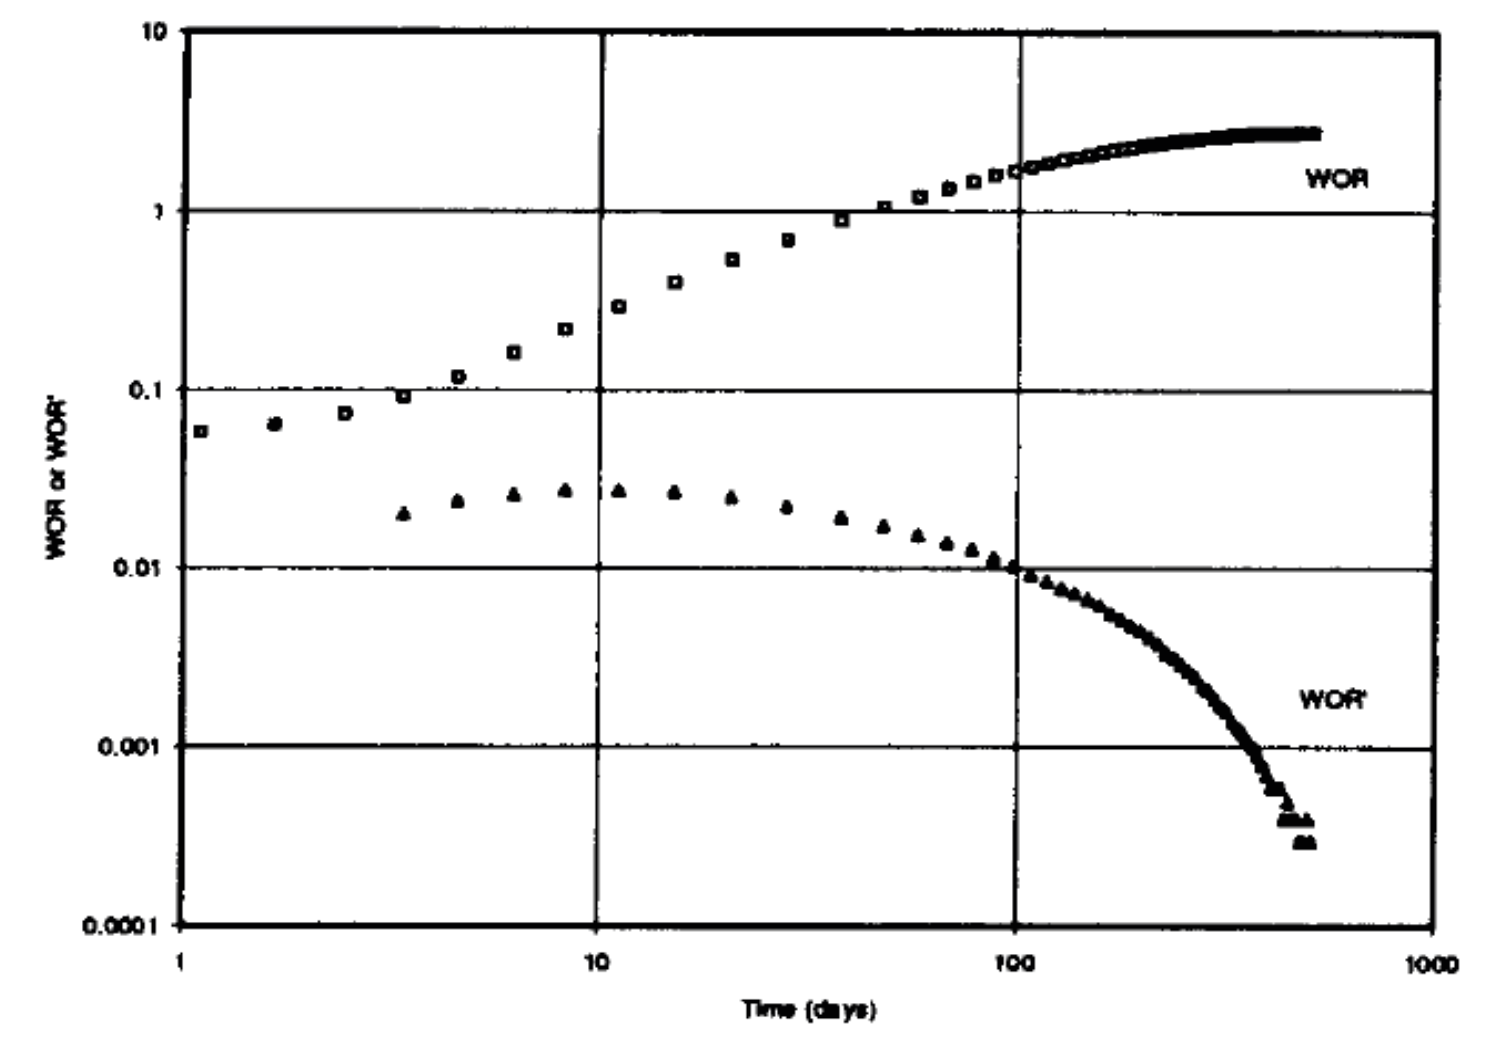
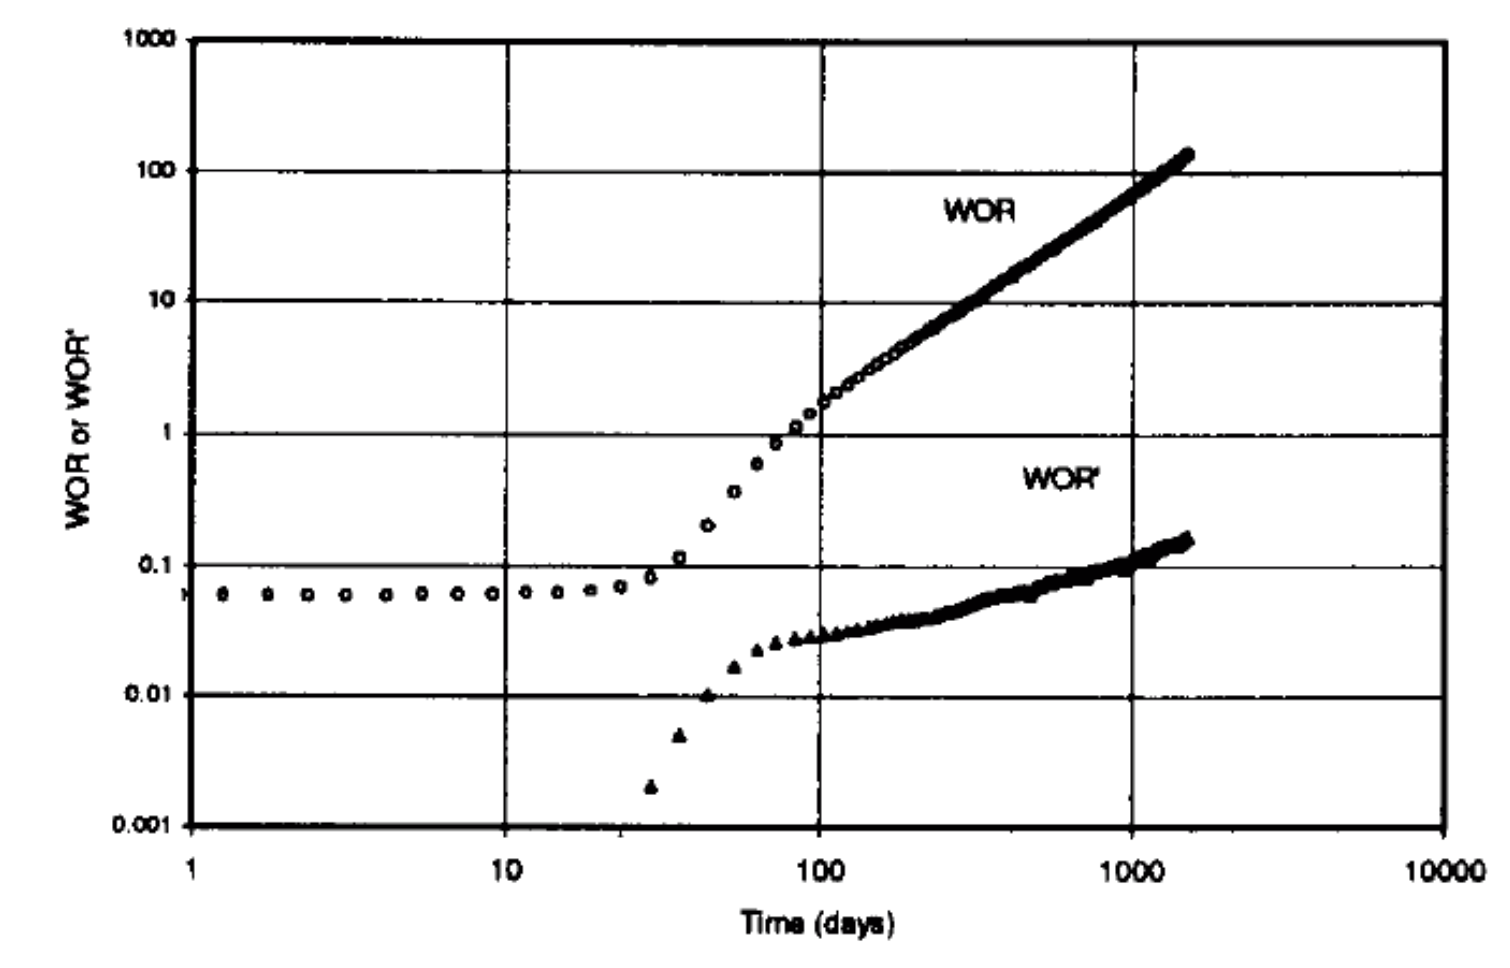
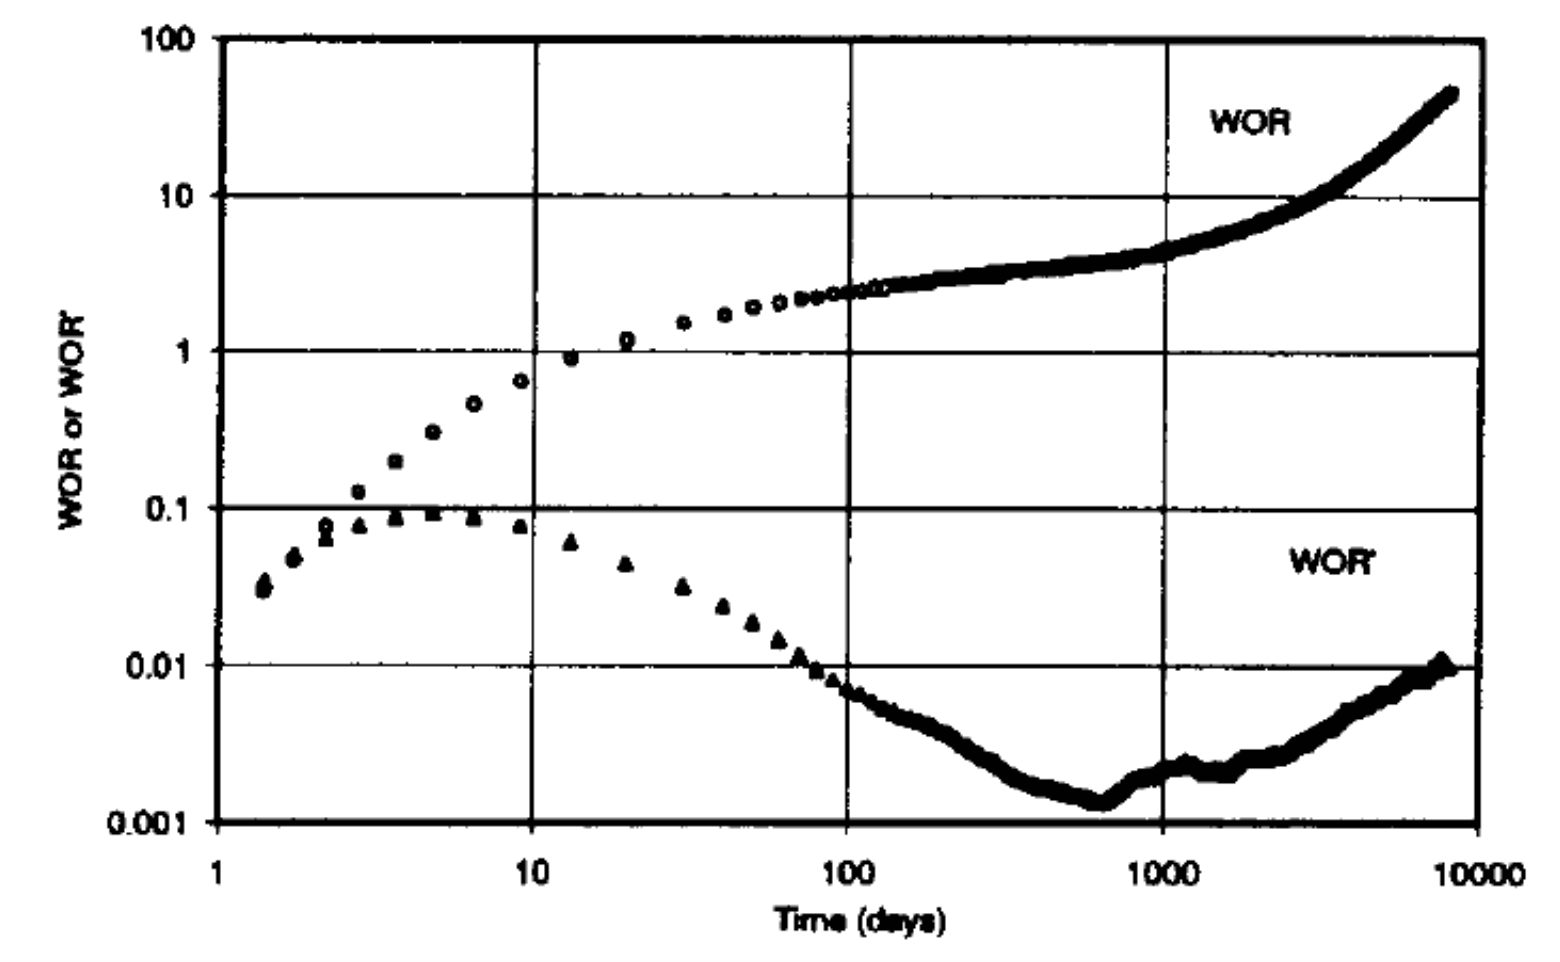
Bilogarithmic plot of WOR and its derivative WOR' against the elapsed time t (see Fig. 1).
It shows different characteristic trends for different water production mechanisms.

|
| |
| Fig. 2.1. Matrix water invasion | Fig. 2.2. Bottom water coning | |
|
| |
| Fig. 2.3. Matrix water invasion with late-time channeling | Fig. 2.4. Bottom water coning with late-time channeling | |
See Also
Petroleum Industry / Upstream / Production / Subsurface Production / Field Study & Modelling / Production Analysis / Watercut Diagnostics