| Name
|
Size
|
Creator |
Creation Date
|
Last Modification Date
|
Labels |
Attached To |
|
PNG File image2020-12-21_23-0-15.png |
87 kB |
Arthur Aslanyan (Nafta College) |
Dec 21, 2020 20:00 |
Dec 21, 2020 20:00 |
|
Page: Black Oil Reservoir
|
|
Microsoft Excel Spreadsheet DCA_Arps_template.xlsx |
414 kB |
Arthur Aslanyan (Nafta College) |
Dec 16, 2020 16:37 |
Dec 16, 2020 16:37 |
|
Page: DCA Arps @model
|
|
PNG File image2020-12-15_23-8-14.png |
21 kB |
Arthur Aslanyan (Nafta College) |
Dec 15, 2020 20:08 |
Dec 15, 2020 20:08 |
|
Page: Harmonic Production Decline
|
|
PNG File image2020-12-15_23-8-3.png |
21 kB |
Arthur Aslanyan (Nafta College) |
Dec 15, 2020 20:08 |
Dec 15, 2020 20:08 |
|
Page: Harmonic Production Decline
|
|
PNG File image2020-12-15_23-7-52.png |
24 kB |
Arthur Aslanyan (Nafta College) |
Dec 15, 2020 20:07 |
Dec 15, 2020 20:07 |
|
Page: Harmonic Production Decline
|
|
PNG File image2020-12-15_23-6-15.png |
19 kB |
Arthur Aslanyan (Nafta College) |
Dec 15, 2020 20:06 |
Dec 15, 2020 20:06 |
|
Page: Hyperbolic Production Decline
|
|
PNG File image2020-12-15_23-6-1.png |
19 kB |
Arthur Aslanyan (Nafta College) |
Dec 15, 2020 20:06 |
Dec 15, 2020 20:06 |
|
Page: Hyperbolic Production Decline
|
|
PNG File image2020-12-15_23-5-48.png |
21 kB |
Arthur Aslanyan (Nafta College) |
Dec 15, 2020 20:05 |
Dec 15, 2020 20:05 |
|
Page: Hyperbolic Production Decline
|
|
PNG File image2020-12-15_22-49-28.png |
20 kB |
Arthur Aslanyan (Nafta College) |
Dec 15, 2020 19:49 |
Dec 15, 2020 19:49 |
|
Page: Exponential Production Decline
|
|
PNG File image2020-12-15_22-49-16.png |
20 kB |
Arthur Aslanyan (Nafta College) |
Dec 15, 2020 19:49 |
Dec 15, 2020 19:49 |
|
Page: Exponential Production Decline
|
|
PNG File image2020-12-15_22-49-0.png |
22 kB |
Arthur Aslanyan (Nafta College) |
Dec 15, 2020 19:49 |
Dec 15, 2020 19:49 |
|
Page: Exponential Production Decline
|
|
PNG File image2020-12-15_18-2-18.png |
21 kB |
Arthur Aslanyan (Nafta College) |
Dec 15, 2020 15:02 |
Dec 15, 2020 15:02 |
|
Page: Decline Curve Analysis = DCA
|
|
PNG File image2020-12-15_18-1-58.png |
19 kB |
Arthur Aslanyan (Nafta College) |
Dec 15, 2020 15:01 |
Dec 15, 2020 15:01 |
|
Page: Decline Curve Analysis = DCA
|
|
PNG File image2020-12-15_18-1-41.png |
19 kB |
Arthur Aslanyan (Nafta College) |
Dec 15, 2020 15:01 |
Dec 15, 2020 15:01 |
|
Page: Decline Curve Analysis = DCA
|
|
PNG File image2020-12-15_18-1-25.png |
22 kB |
Arthur Aslanyan (Nafta College) |
Dec 15, 2020 15:01 |
Dec 15, 2020 15:01 |
|
Page: Decline Curve Analysis = DCA
|
|
PNG File image2020-12-14_1-16-59.png |
105 kB |
Arthur Aslanyan (Nafta College) |
Dec 13, 2020 22:17 |
Dec 13, 2020 22:17 |
|
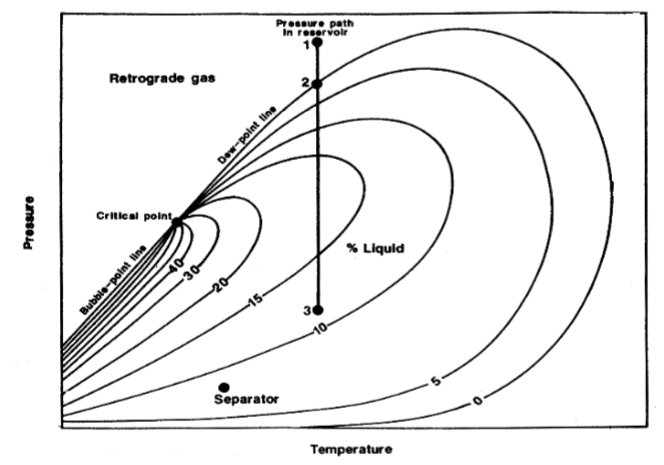
Page: Retrograde Gas Condensate Reservoir
|
|
PNG File image2020-12-14_1-5-39.png |
87 kB |
Arthur Aslanyan (Nafta College) |
Dec 13, 2020 22:05 |
Dec 13, 2020 22:05 |
|
Page: Wet Gas Reservoir
|
|
PNG File image2020-12-13_11-13-51.png |
45 kB |
Arthur Aslanyan (Nafta College) |
Dec 13, 2020 08:13 |
Dec 13, 2020 08:13 |
|
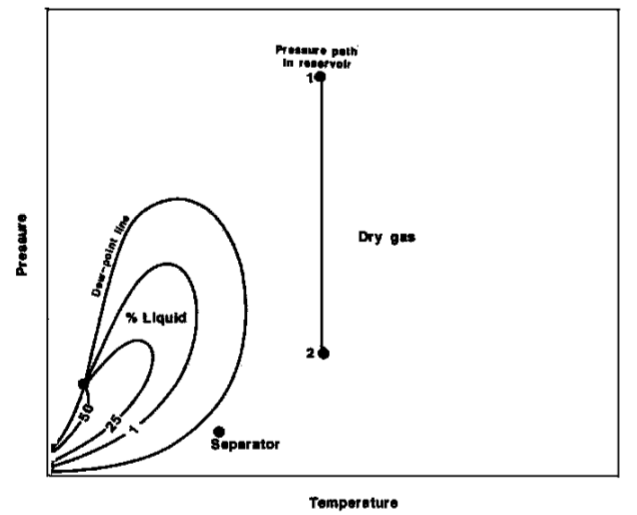
Page: Dry Gas Reservoir
|
|
PNG File image2020-12-4_22-24-32.png |
64 kB |
Arthur Aslanyan (Nafta College) |
Dec 10, 2020 09:50 |
Dec 10, 2020 09:50 |
|
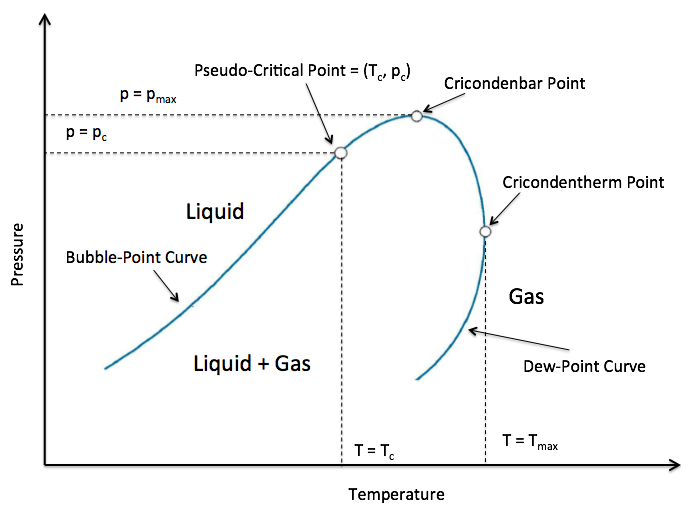
Page: Vapour Liquid Envelope
|
|
PNG File image2020-12-4_22-24-32.png |
64 kB |
Arthur Aslanyan (Nafta College) |
Dec 10, 2020 06:36 |
Dec 10, 2020 06:36 |
|
Page: Bubblepoint Curve
|