Natural Gas Reservoir with initial formation temperature
T_i > T_{c, \rm max} above Cricondentherm
T_{c, \rm max} and producing condensate at separator (i.e. the separator conditions staying inside Vapour Liquid Envelope, see Fig. 1).
|
Fig. 1. Production path of the Wet Gas Reservoir on the Phase Equilibrium Diagram. The downward solid black arrow shows a reservoir pressure depletion path. The downward grey dash arrow shows a wellbore lift pressure drop path. |
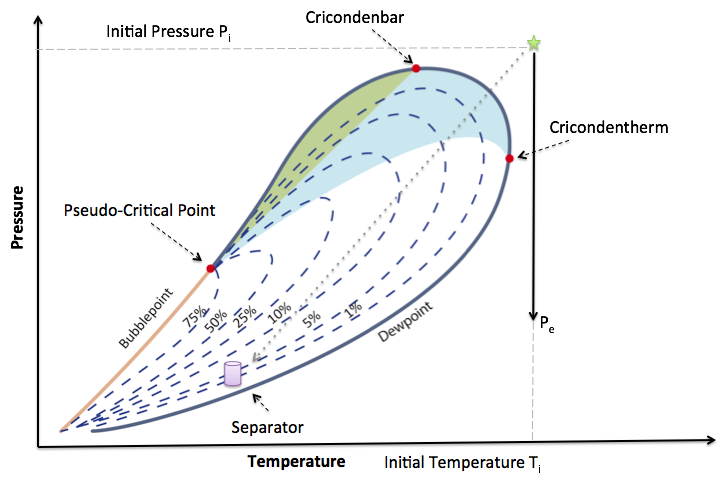
Table 1 – Example of Wet Gas composition (in mol % )
| CO2 | 1.41 |
| N2 | 0.25 |
| C1 | 92.46 |
| C2 | 3.18 |
| C3 | 1.01 |
| i C4 | 0.28 |
| n C4 | 0.24 |
| i C5 | 0.13 |
| n C5 | 0.08 |
| C6s | 0.14 |
| C7+ | 0.82 |
| Rs (SCF/STB) | 69,000 |
| Rv (STB/MMSCF) | 15 |
| API gravity | 65.0 |
| M7+ | 132 |
| γ7+ | 0.750 |
See Also
Petroleum Industry / Upstream / Subsurface E&P Disciplines / Petroleum Geology / Petroleum Reservoir / Hydrocarbon reservoir / Natural Gas Reservoir
[ Hydrocarbon Reserves ][ Depletion ]