Undersaturated Oil Reservoir with initial temperature slightly lower the pseudo-critical temperature and the Vapour Liquid Envelope having quality lines tighter spaced at reservoir conditions while separator conditions lying on relatively low quality lines.
A small reduction of pressure below the bubble point vaporizes a significant fraction of the oil.
|
Fig. 1. Production path of the Volatile Oil Reservoir on the Phase Equilibrium Diagram. The downward solid black arrow shows a reservoir pressure depletion path. The downward grey dash arrow shows a wellbore lift pressure drop path. |
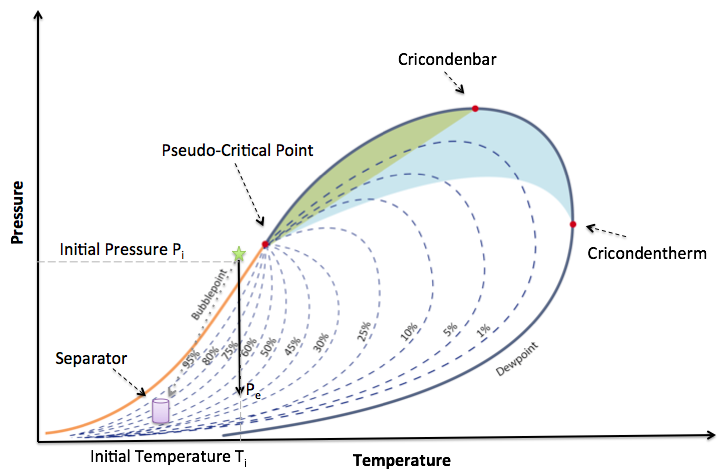
Table 1 – Example of Volatile Oil composition (in mol % )
| CO2 | 1.82 |
| N2 | 0.24 |
| C1 | 57.60 |
| C2 | 7.35 |
| C3 | 4.21 |
| i C4 | 0.74 |
| n C4 | 2.07 |
| i C5 | 0.53 |
| n C5 | 0.95 |
| C6s | 1.92 |
| C7+ | 22.57 |
| Rs (SCF/STB) | 1465 |
| Rv (STB/MMSCF) | 680 |
| API gravity | 36.7 |
| M7+ | 240 |
| γ7+ | 0.864 |
See Also
Petroleum Industry / Upstream / Subsurface E&P Disciplines / Petroleum Geology / Petroleum reservoir / Hydrocarbon reservoir / Oil Reservoir / Undersaturated Oil Reservoir
[ Hydrocarbon Reserves ][ Depletion ]
[ Volatile Oil ][ Volatile Oil Fluid @model ]