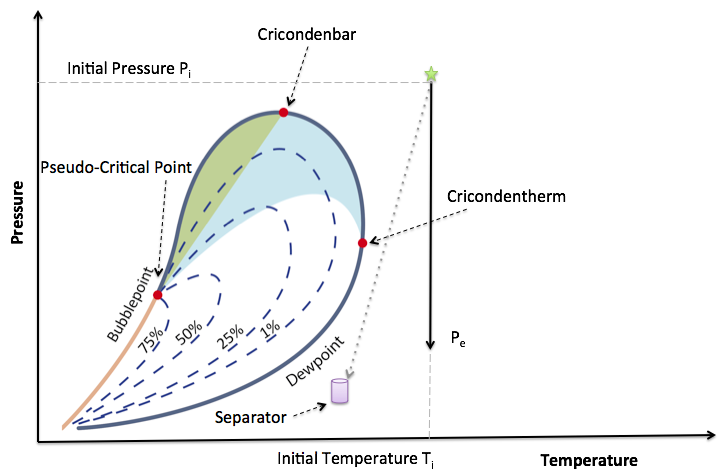
Natural Gas Reservoir with initial formation temperature
T_i > T_{c, \rm max} above Cricondentherm
T_{c, \rm max} and stays gaseuous at separator (outside Vapour Liquid Envelope, see Fig. 1).
|
Fig. 1. Production path of the Dry Gas Reservoir on the Phase Equilibrium Diagram. The downward solid black arrow shows a reservoir pressure depletion path. The downward grey dash arrow shows a wellbore lift pressure drop path. |
See Also
Petroleum Industry / Upstream / Subsurface E&P Disciplines / Petroleum Geology / Petroleum Reservoir / Hydrocarbon reservoir / Natural Gas Reservoir
[ Hydrocarbon Reserves ][ Depletion ]