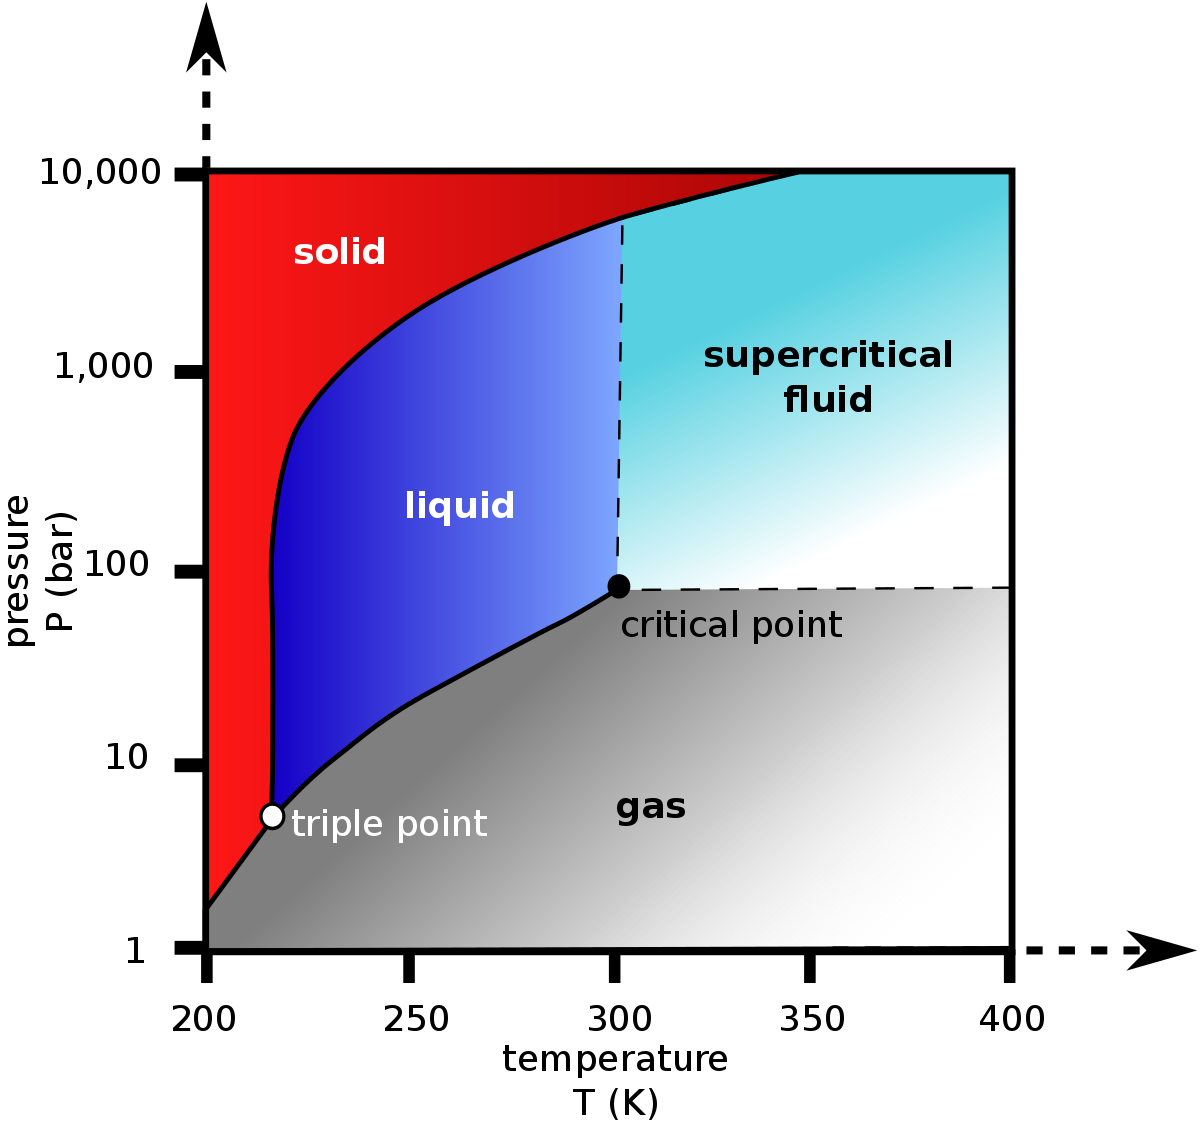
A graph showing different states of Thermodynamic system at certain Temperature and Pressure point (Fig. 1).
|
| Fig. 1. Example of PT diagram |
See also
Natural Science / Physics / Thermodynamics
A graph showing different states of Thermodynamic system at certain Temperature and Pressure point (Fig. 1).
|
| Fig. 1. Example of PT diagram |
Natural Science / Physics / Thermodynamics