A state of Thermodynamic equilibrium between the liquid and gas state.
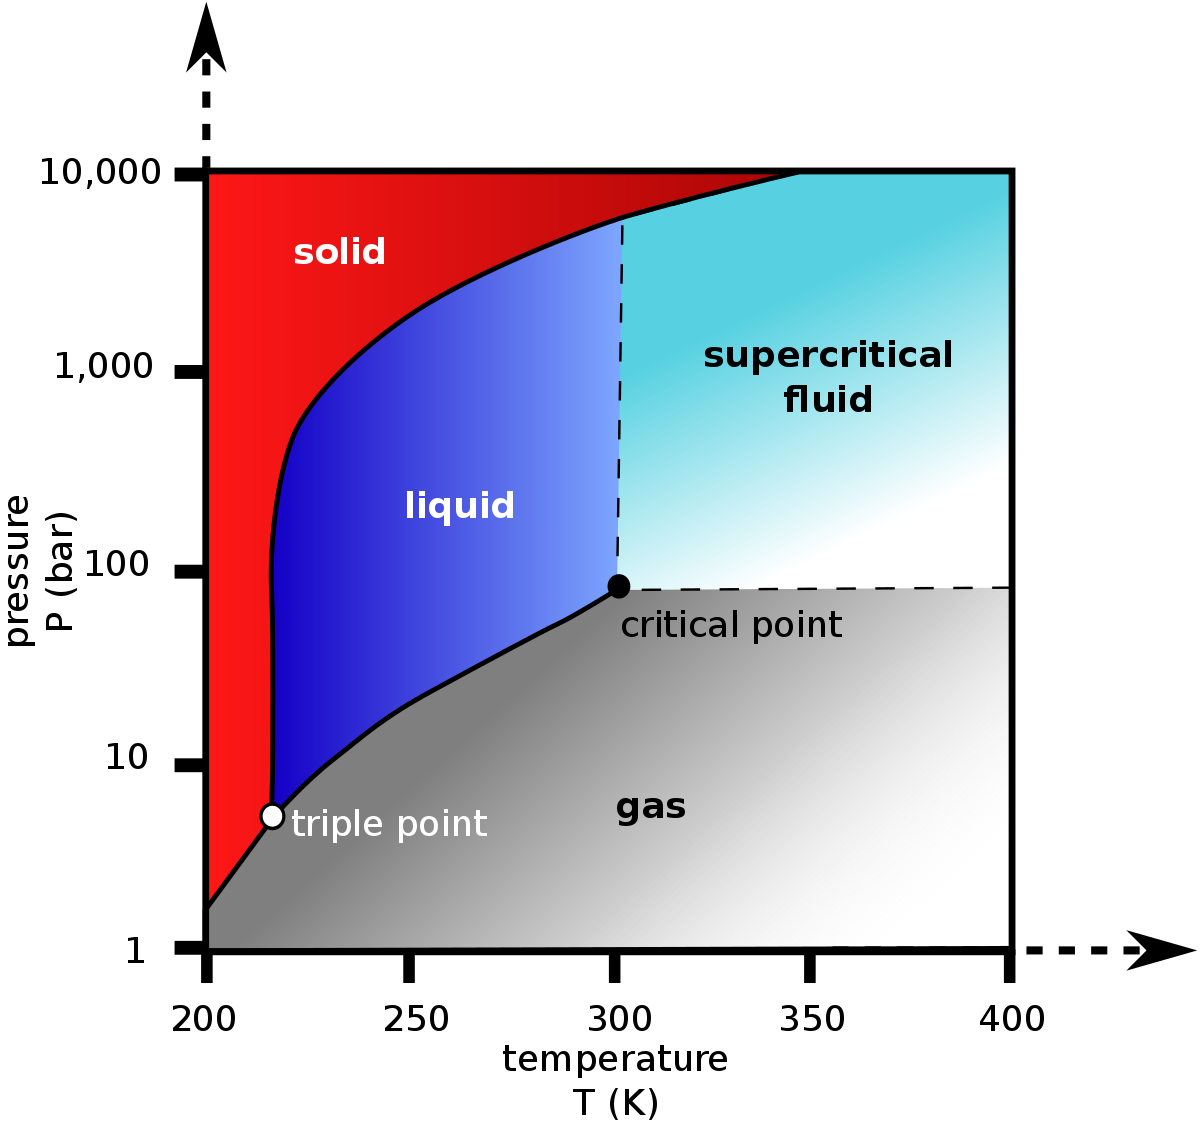
The PT diagram for Pure Substance will see Vapour Liquid Equilibrium (VLE) as a set of points along a smooth growing curve ending up with a Critical Point
(T_c, p_c) (see Fig. 1).
The PT diagram for Fluid Mixture will see Vapour Liquid Equilibrium (VLE) as a closed area with an apex of Pseudo-Critical Point (T_{pc}, p_{pc}) (see Fig. 2).
| |
| Fig. 1. Schematic PT diagram with Vapour Liquid Equilibrium curve and Critical Point. | Fig. 2. Schematic PT diagram with Vapour Liquid Equilibrium area and Pseudo-Critical Point. |
See also
Natural Science / Physics / Thermodynamics / Thermodynamic system / Thermodynamic equilibrium
[ Pure Substance ]
[ Сritical Temperature Tc ] [ Critical Pressure (pc) ]