The apex point of Vapour Liquid Equilibrium (VLE) area on PT diagram of Fluid Mixture (see Fig. 1).
It is characterized by critical temperature
T_c and critical pressure
p_c.
|
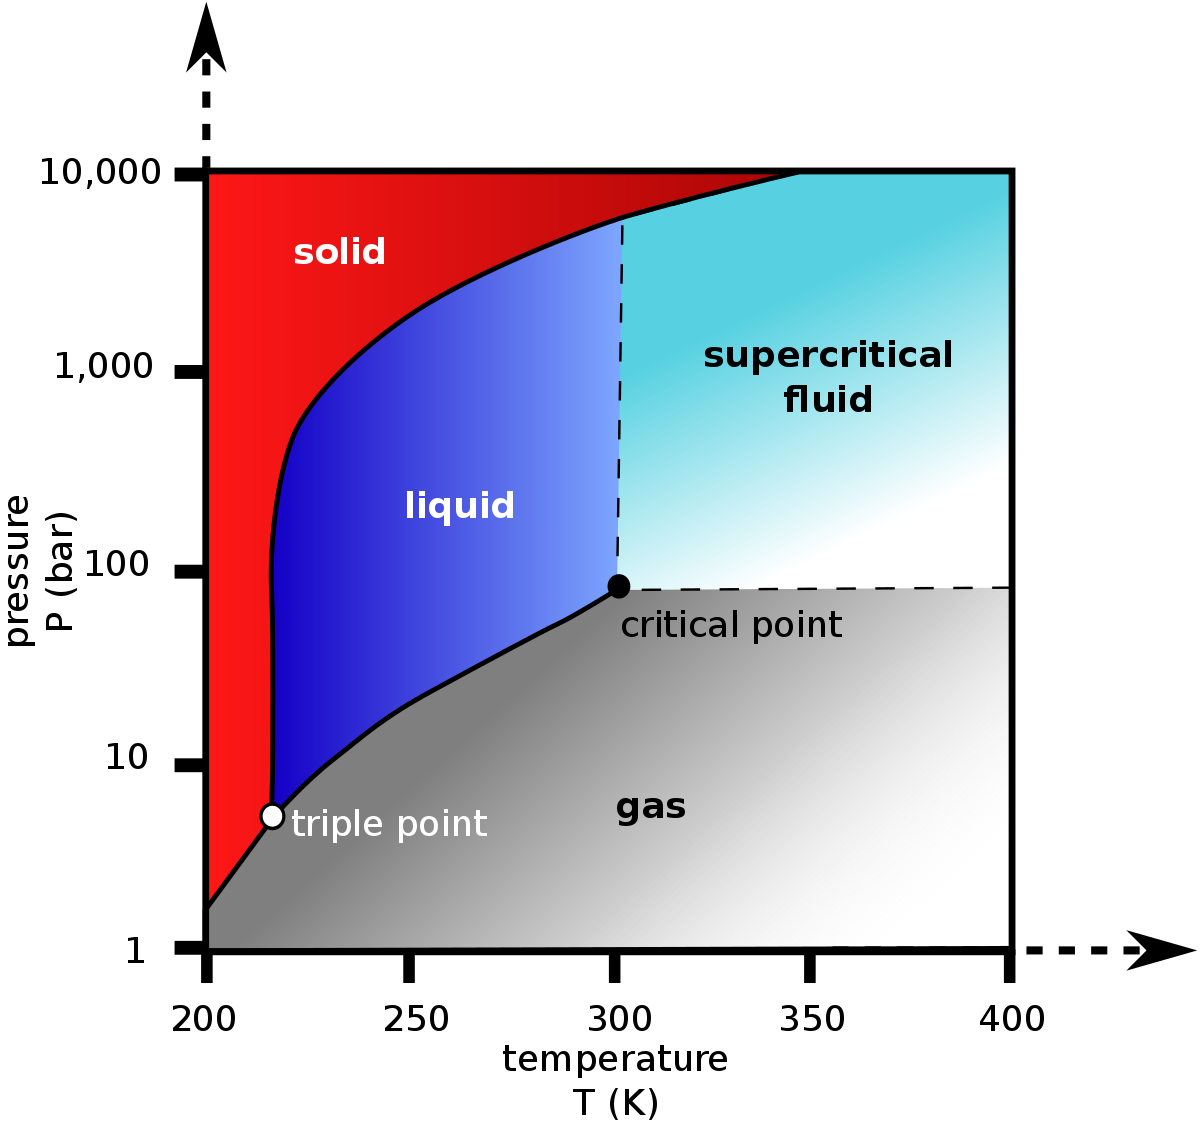
| Fig. 1. Schematic PT diagram with Vapour Liquid Equilibrium and Pseudo-Critical Point (Tpc, ppc). |
The simplest estimate of Pseudo-Critical Point
( T_{pc}, \, p_{pc} ) is the mole fraction weighted average:
| (1) | T_{pc} = \sum_i x_i \, T_{c,i} |
| (2) | p_{pc} = \sum_i x_i \, p_{c,i} |
where
x_i | mole fraction of the i-th mixture component |
T_{c,i} | critical temperature of the i-th mixture component |
p_{c,i} | critical pressure of the i-th mixture component |
See also
Natural Science / Physics / Thermodynamics / Thermodynamic system
[ Fluid Mixture ]
[ Pseudo-Critical Point (Tpc, ppc) ][ Pseudo-Critical Temperature (Tpc) ][ Pseudo-Critical Pressure (Ppc)][ Pseudo-Critical Point Correlations @model ]
[ Critical Point (Tc, pc) ][ Сritical Temperature Tc ][ Critical Pressure (pc) ]