You are viewing an old version of this page. View the current version.
Compare with Current View Page History
Version 1 Current »
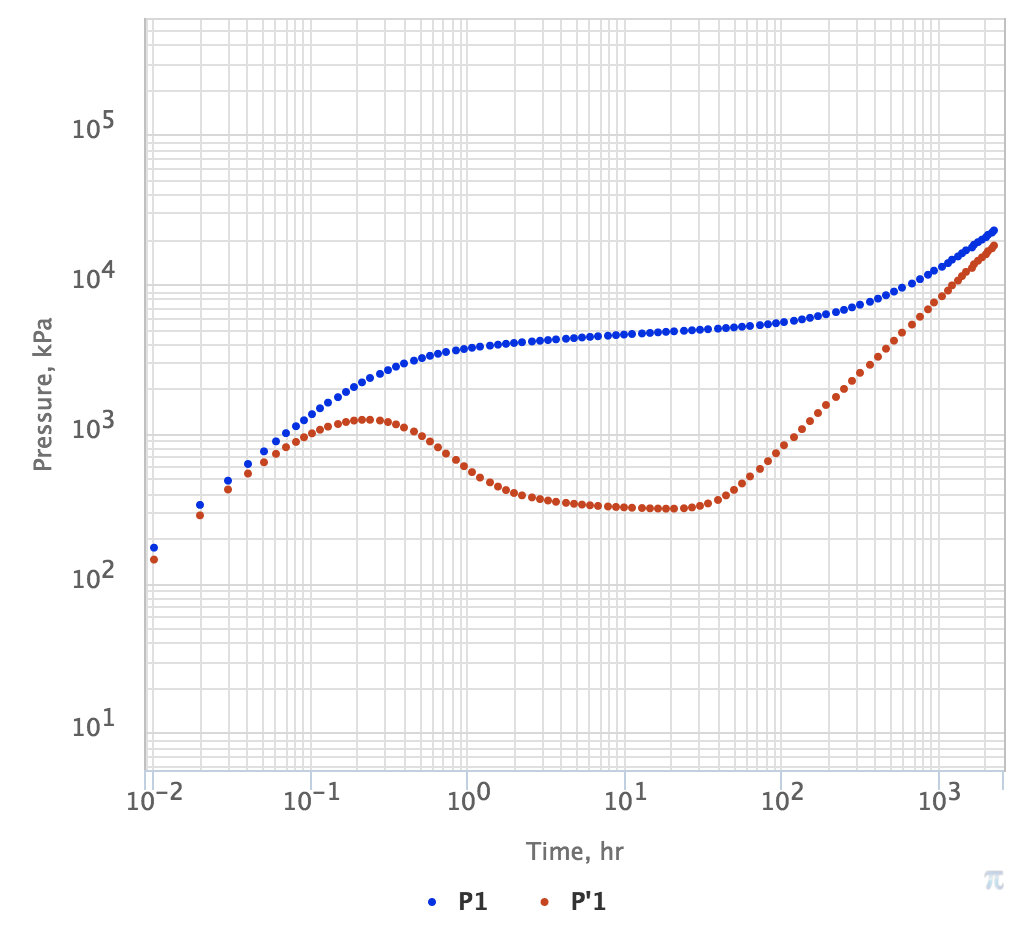
A 2D graph with both axis in logarithmic scale
Fig. 1. Example of two sets of data (red and blue) on a typical
Formal science / Mathematics