|
|
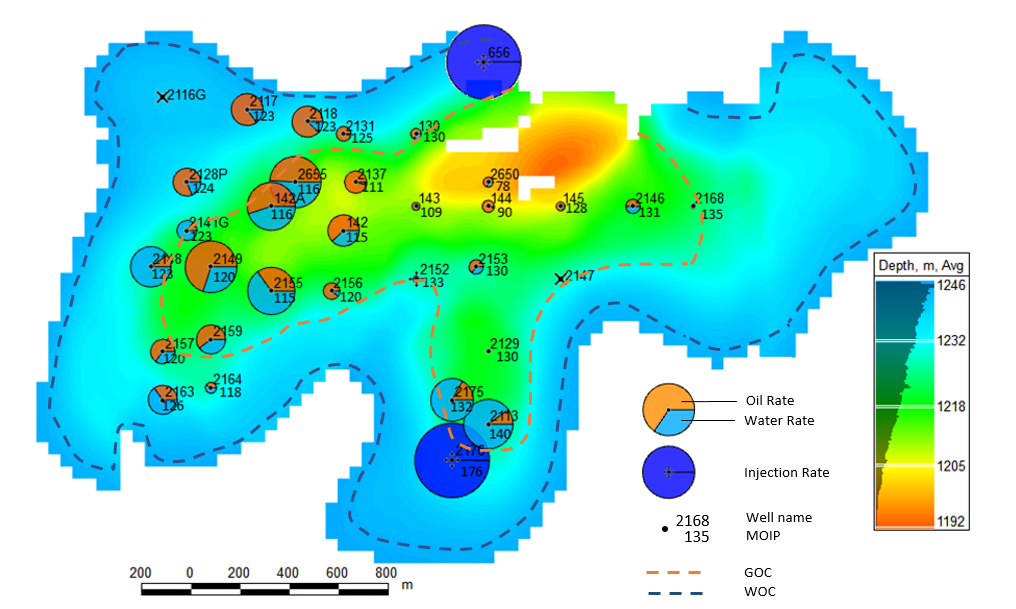
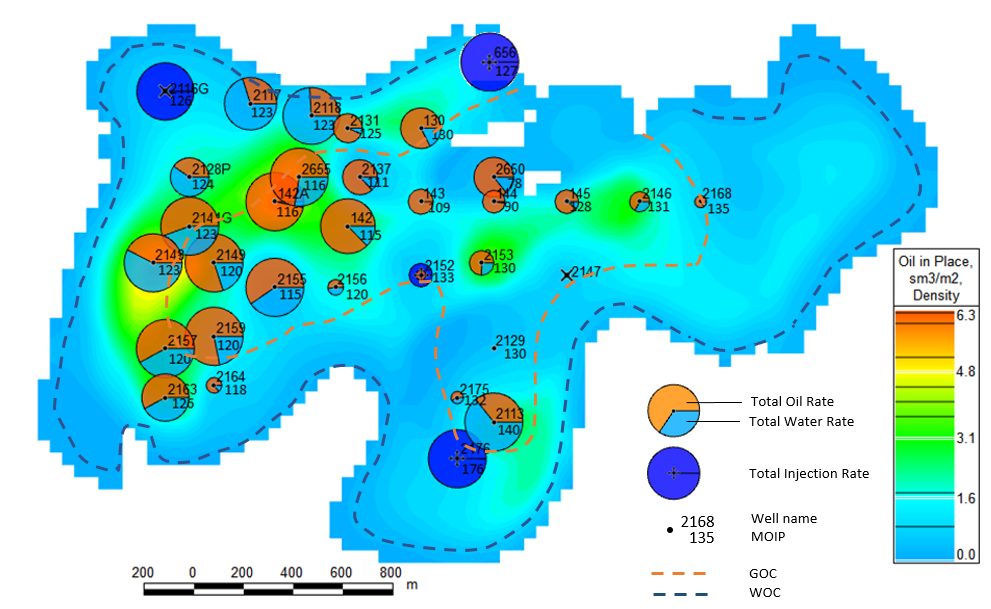
Fig. 1.1. Current Production Map over Structural Map | Fig. 1.2. Cumulative Production Map over OIP Map |
|
|
| Fig. 2.1. Productivity Map over Transmissibility Map | Fig. 2.2. Formation Pressure Map over Recovery Map |
|
|
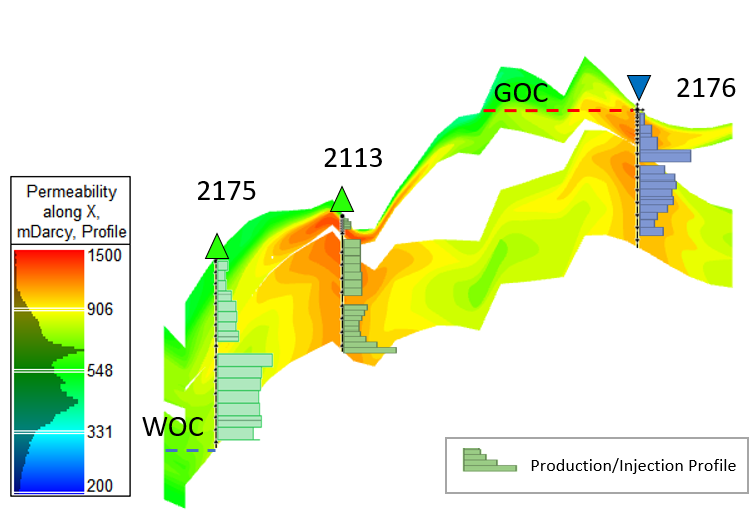
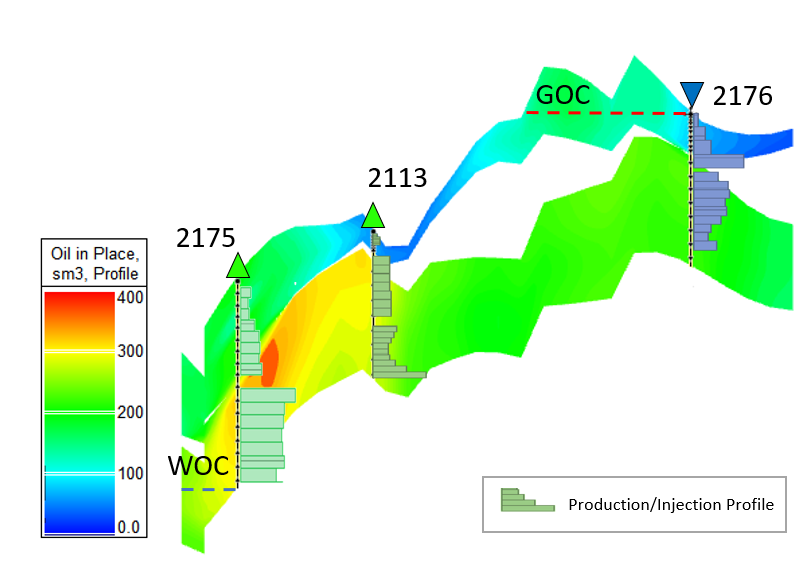
| Fig. 3.1. Vertical Flow Profile over Vertical Permeability Profile | Fig. 3.2. Vertical Flow Profile over Vertical OIP Profile |
|
|
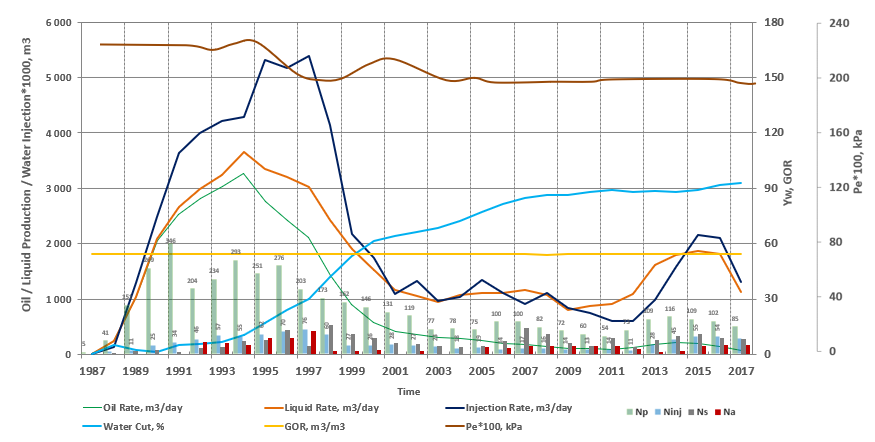
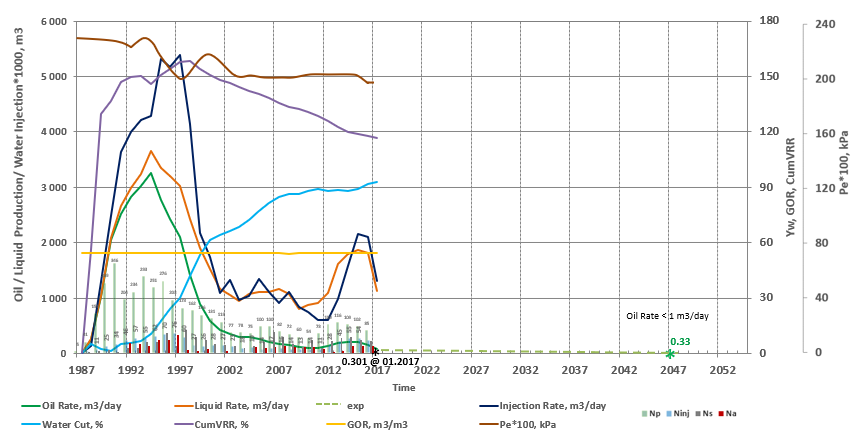
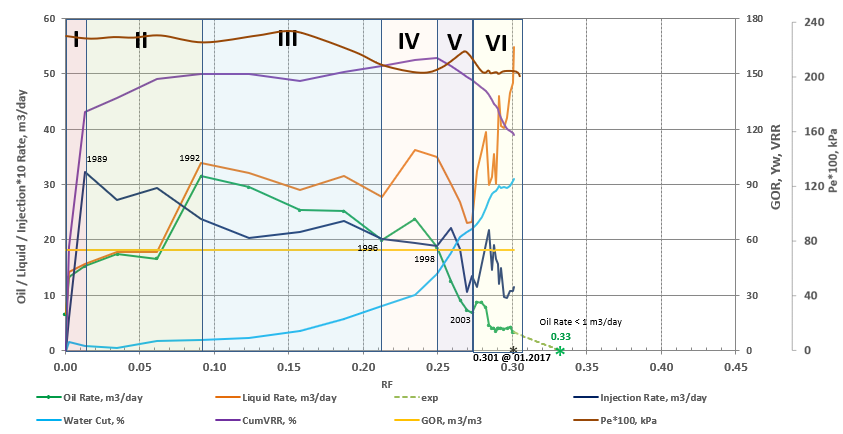
| Fig. 4.1. Production History Graphs | Fig. 4.2. Production Forecasts |
|
|
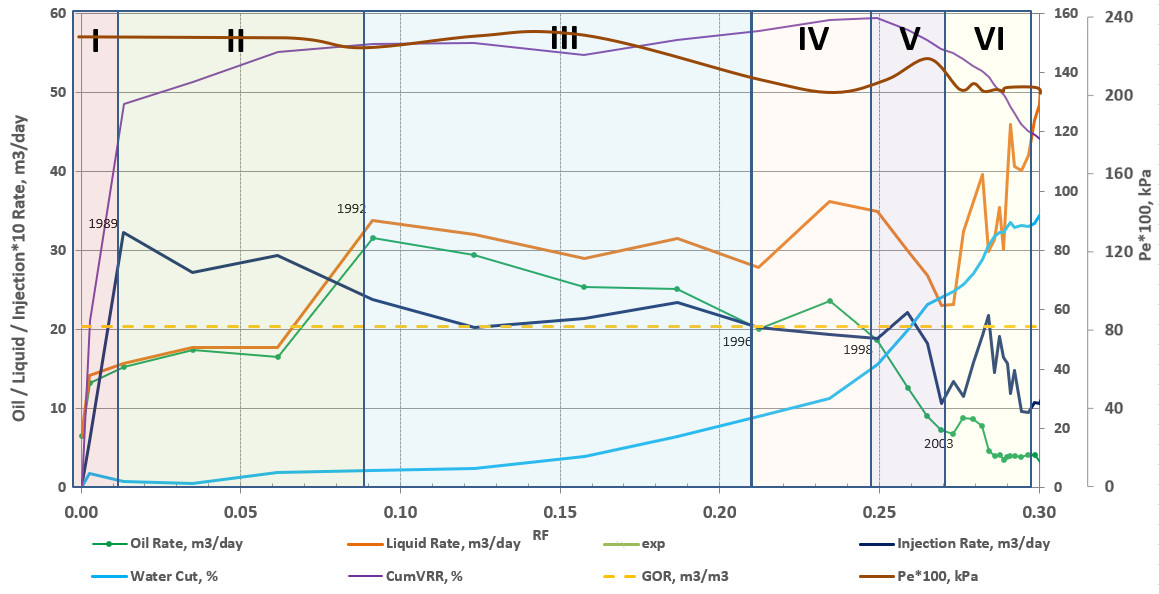
| Fig. 5.1. Recovery History | Fig. 5.2. Recovery Forecasts |
|  |
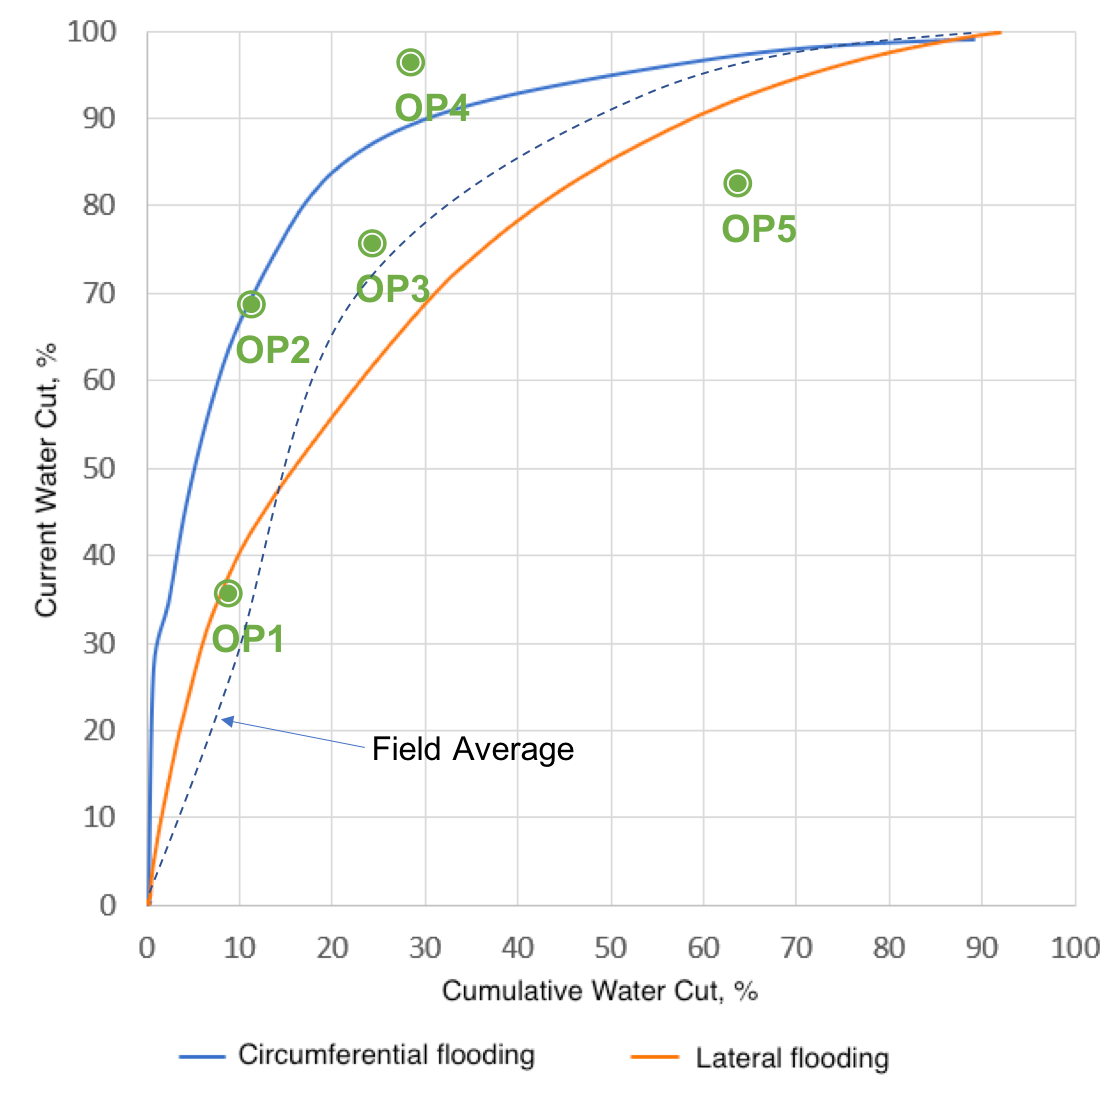
| Fig. 6.1. WOR Sweep Diagnostic | Fig. 6.2. WOR Drawdown Diagnostic |
|
|
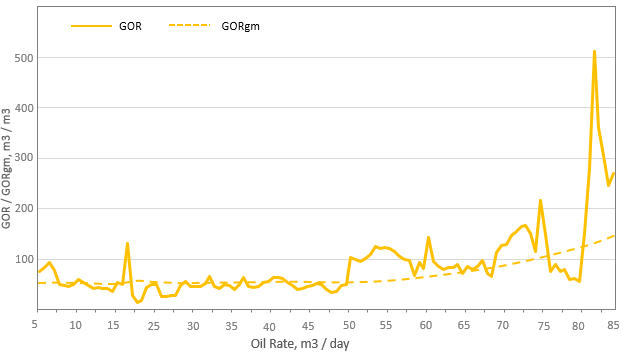
| Fig. 7.1. GOR Diagnostic | Fig. 7.2. GOR Diagnostic |
| Fig. 8.2. Total PI Diagnostic | Fig. 8.2. Well Flow Performance (WFP) |
| |
| Fig. 9.2. Specific Productivity Index Diagnostic |

See Also
Petroleum Industry / Upstream / Production / Subsurface Production / Field Study & Modelling / Production Analysis