...
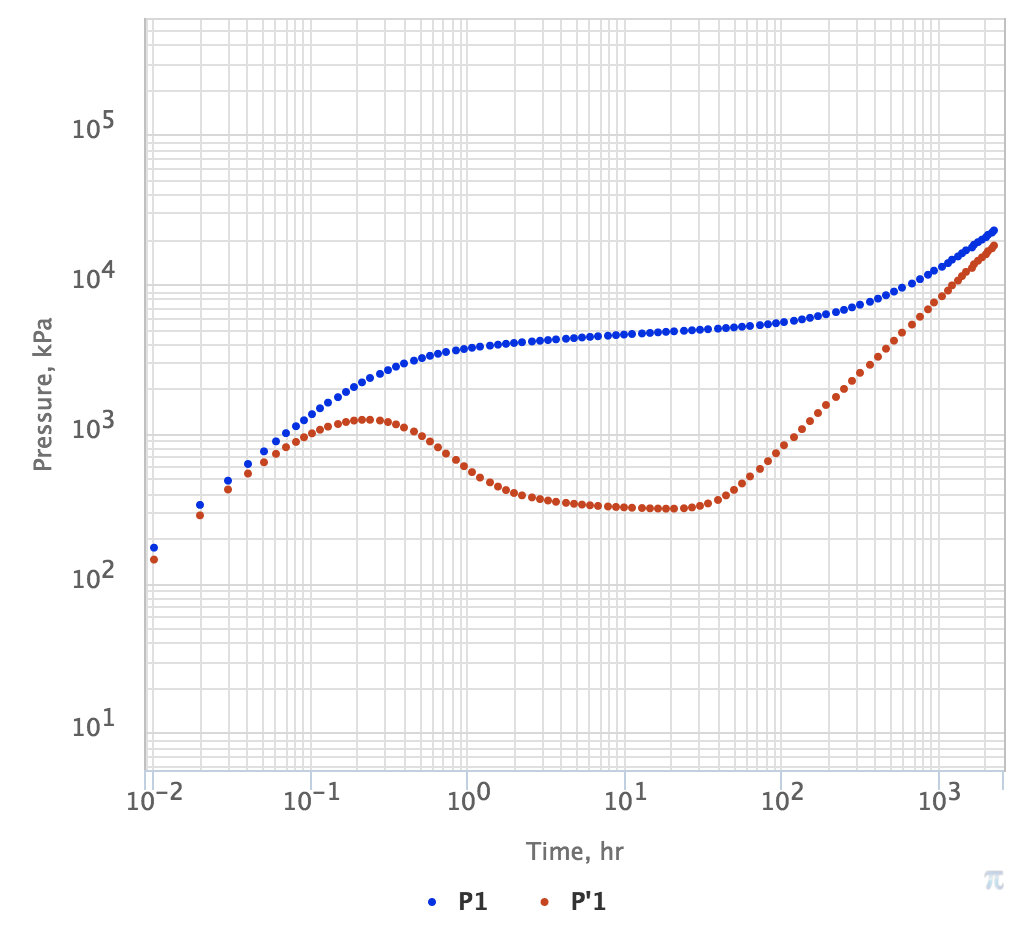
A 2D graph with both axis in logarithmic scale
|
Fig. 1. Example of two sets of data (red and blue) on a typical bilogarithmic plot |
See also
...
...
A 2D graph with both axis in logarithmic scale
|
Fig. 1. Example of two sets of data (red and blue) on a typical bilogarithmic plot |
...