...
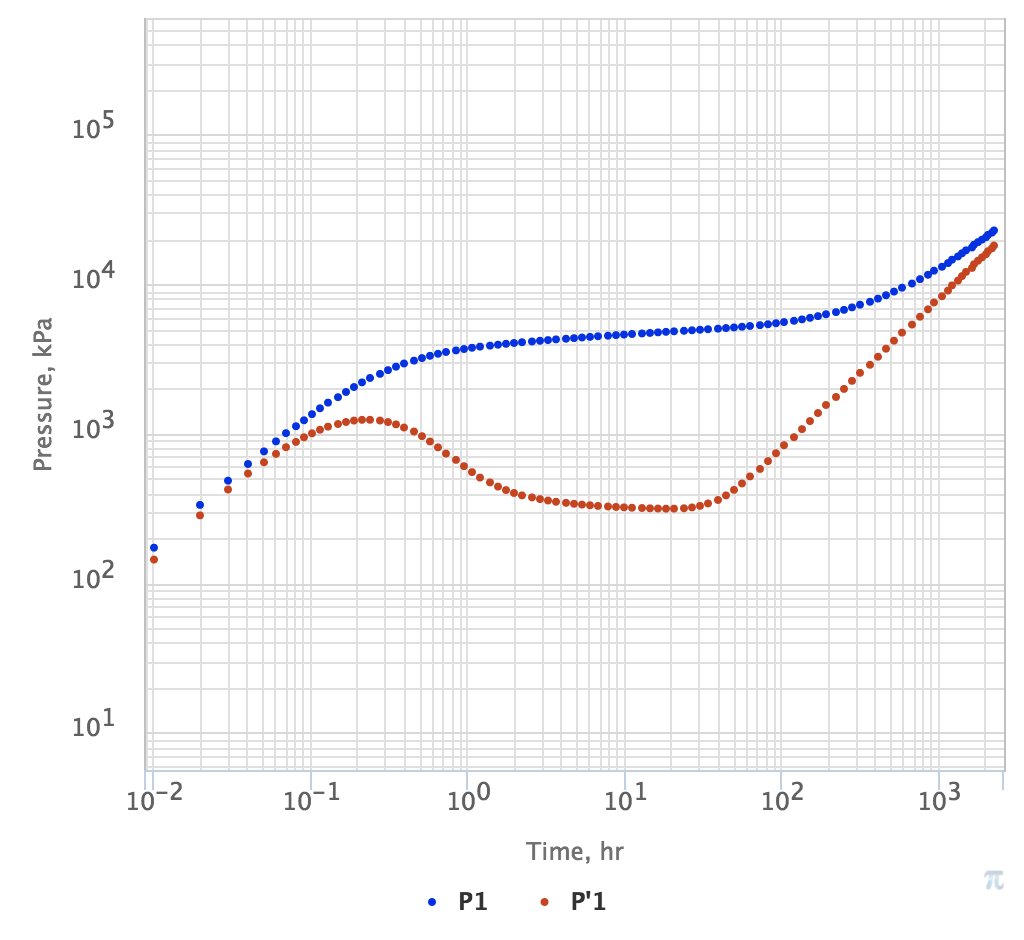
A bilogarithmic plot of pressure drop P and its log-derivative P'.
This plot represents the key diagnostic metric for Pressure Transient Analysis.
|
Fig. 1. Example of pressure log-log plot showing DTR Pressure drop P in blue and log-derivative P' in red |
...