...
It further splits into (see Fig. 1):
| DTR | pressure response to unit-rate production in the same well |
| CTR | pressure response to unit-rate production in the remote well |
|
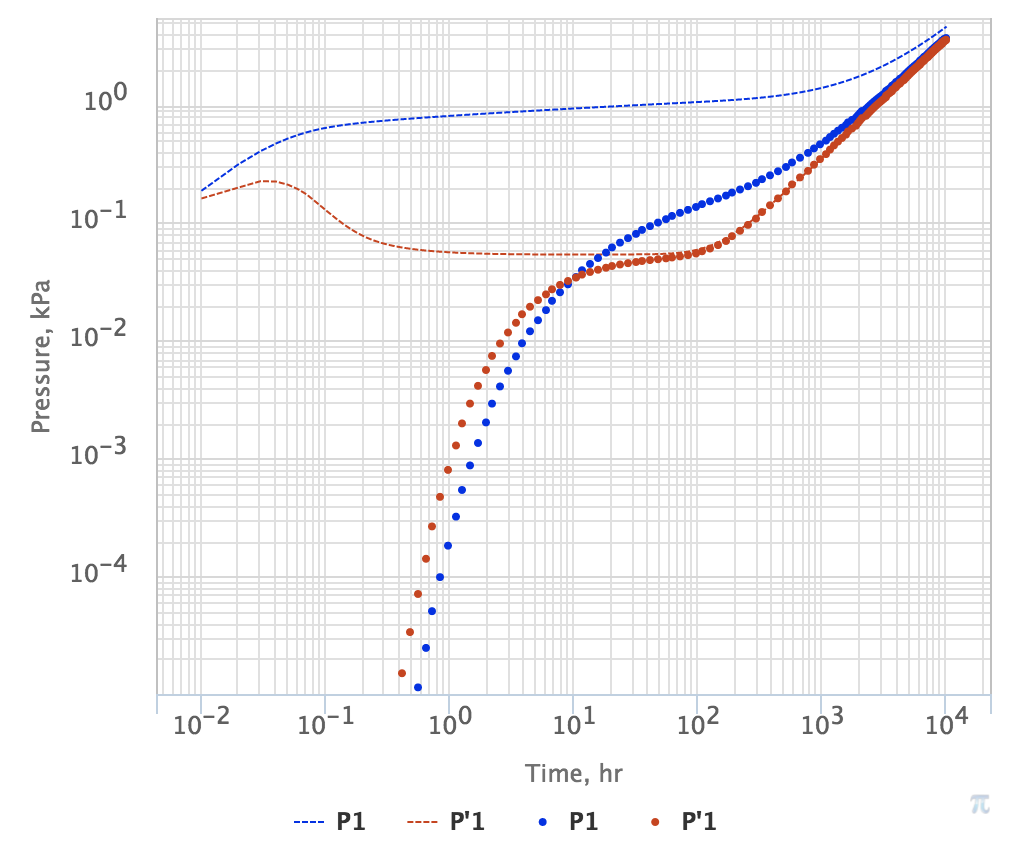
Fig. 1. A sample of typical DTR (dash line) and CTR (circles) for a 2-well system presented on PTA type-library log-log plot. (pressure drop P in blue and log-derivative P' in red). One well is producing at unit-rate and the other one is shut-in. In this case, LTRs on both UTRs are the same because two wells are sharing the same reservoir volume. |
The source of UTRs are:
| Numerical pressure simulations | Numerical flow simulations | Deconvolution of long-term PDG data records | Pressure Interference Testing |
The most common use of UTRs is to assemble a Pressure Interference Matrix and perform:
| Qualitative analyses of the reservoir properties | Qualitative analysis with Unit-rate Transient Response Model (UTRM) |
See Also
...
Petroleum Industry / Upstream / Subsurface E&P Disciplines / Well Testing / Pressure Testing
...