...
Time interval of pressure transition when pressure drop
| LaTeX Math Inline | ||
|---|---|---|
|
...
| LaTeX Math Block | ||||
|---|---|---|---|---|
| ||||
\Deltadelta p = p_{wf}(0) - p_{wf}(t) \sim p_{wf}(0) - p_i - \frac{q_t}{4 \pi \sigma} \, \bigg[ - 2S + \gamma - \ln \bigg( \frac{4 \chi t}{r_w^2} \bigg) \bigg] |
...
| LaTeX Math Block | ||||
|---|---|---|---|---|
| ||||
\Deltadelta p ' = \frac{d \, \Delta p}{d \, \ln t} = \frac{q_t}{4 \pi \sigma} = \rm const |
...
|
|
|
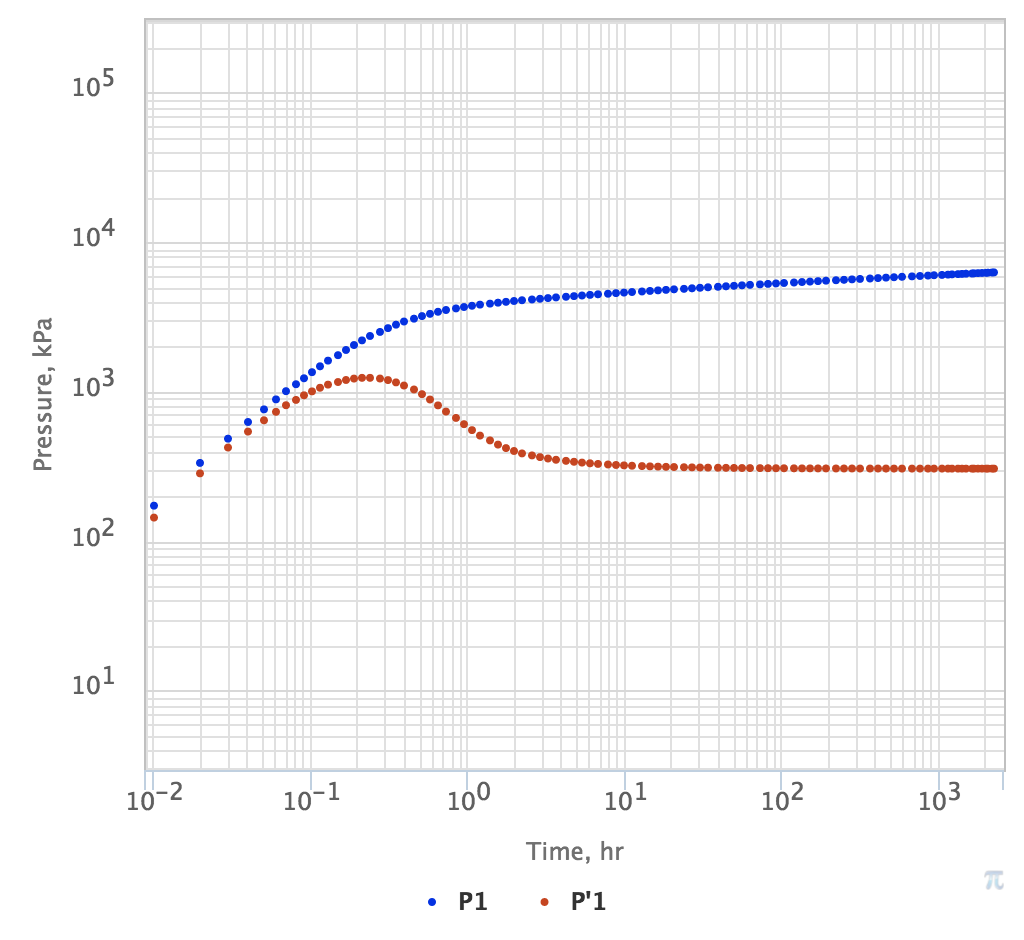
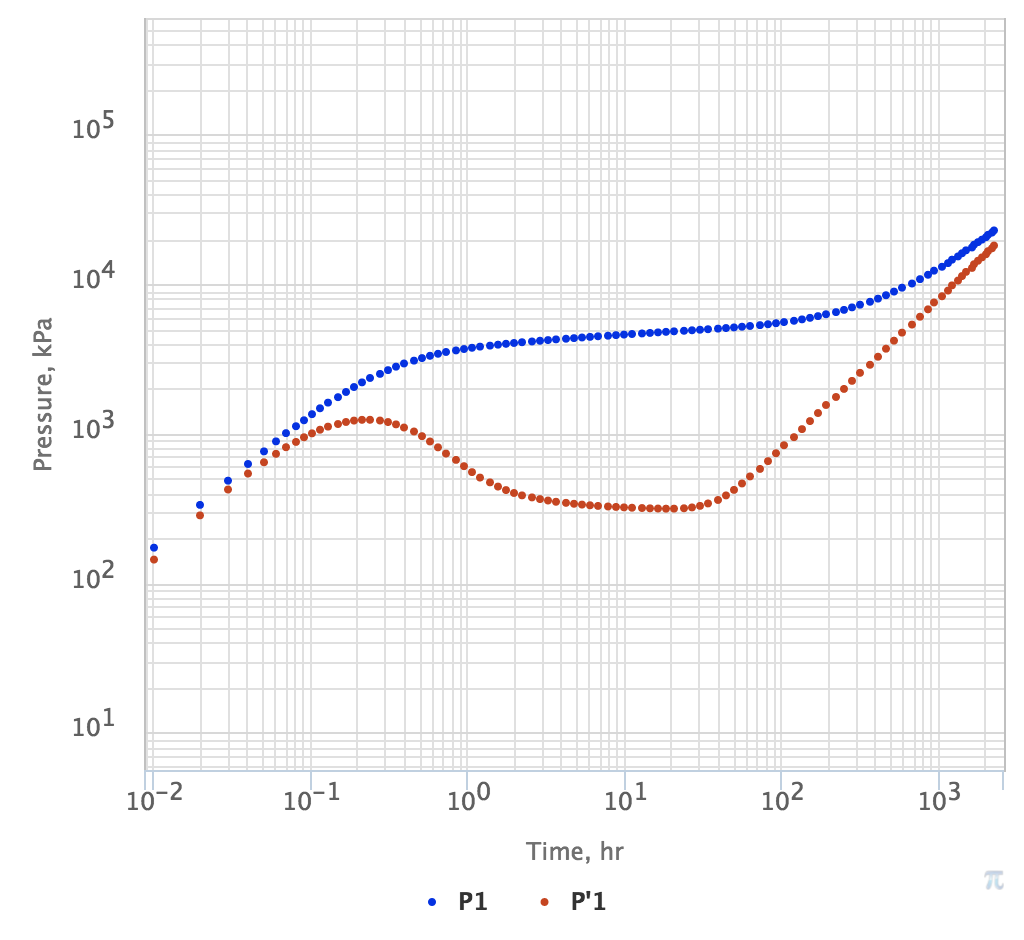
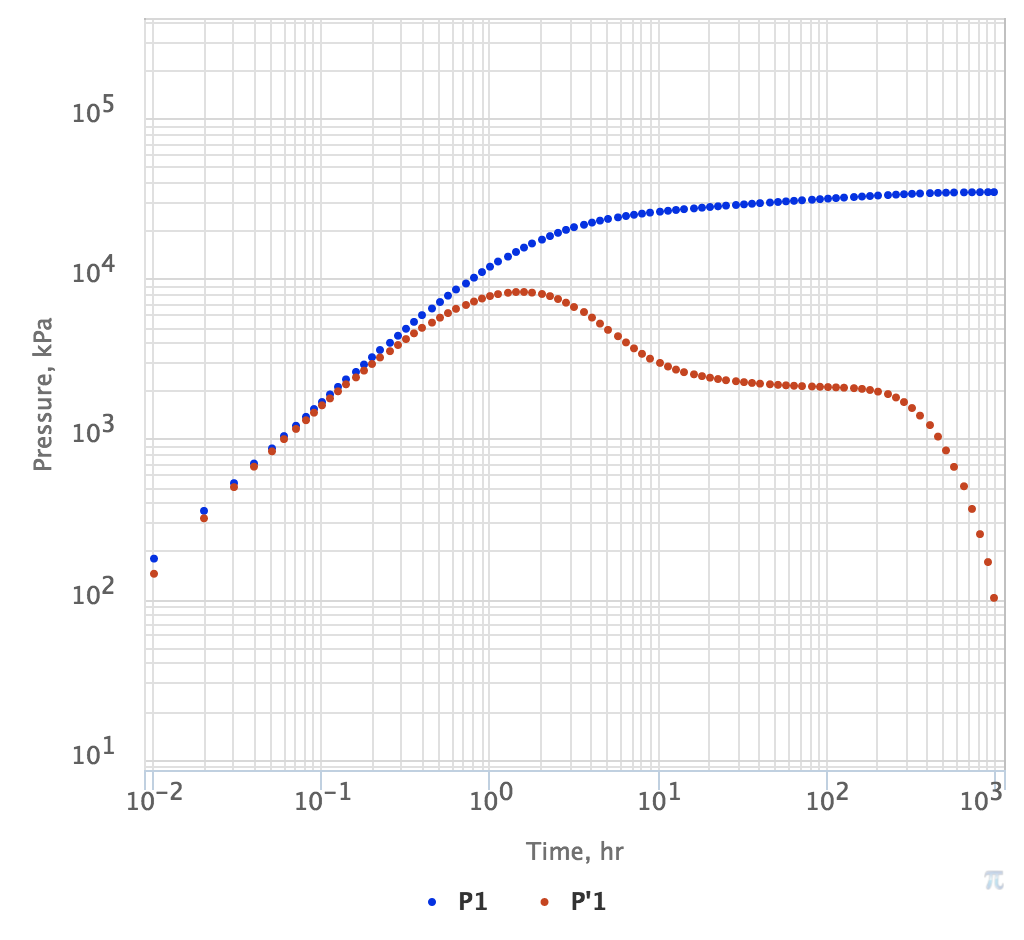
| Fig. 1. PTA Diagnostic Plot with IARF regime developing after 100 hrs | Fig. 2. PTA Diagnostic Plot with IARF regime developing after 100 hrs until PSS at 1,000 hrs | Fig. 3. PTA Diagnostic Plot with IARF regime developing after 100 hrs until SS at 1,000 hrs |
See Also
...
Petroleum Industry / Upstream / Subsurface E&P Disciplines / Field Study & Modelling / Reservoir Flow Simulation
[ Pressure Testing ] [ Boundary Dominated Flow (BDF) ]