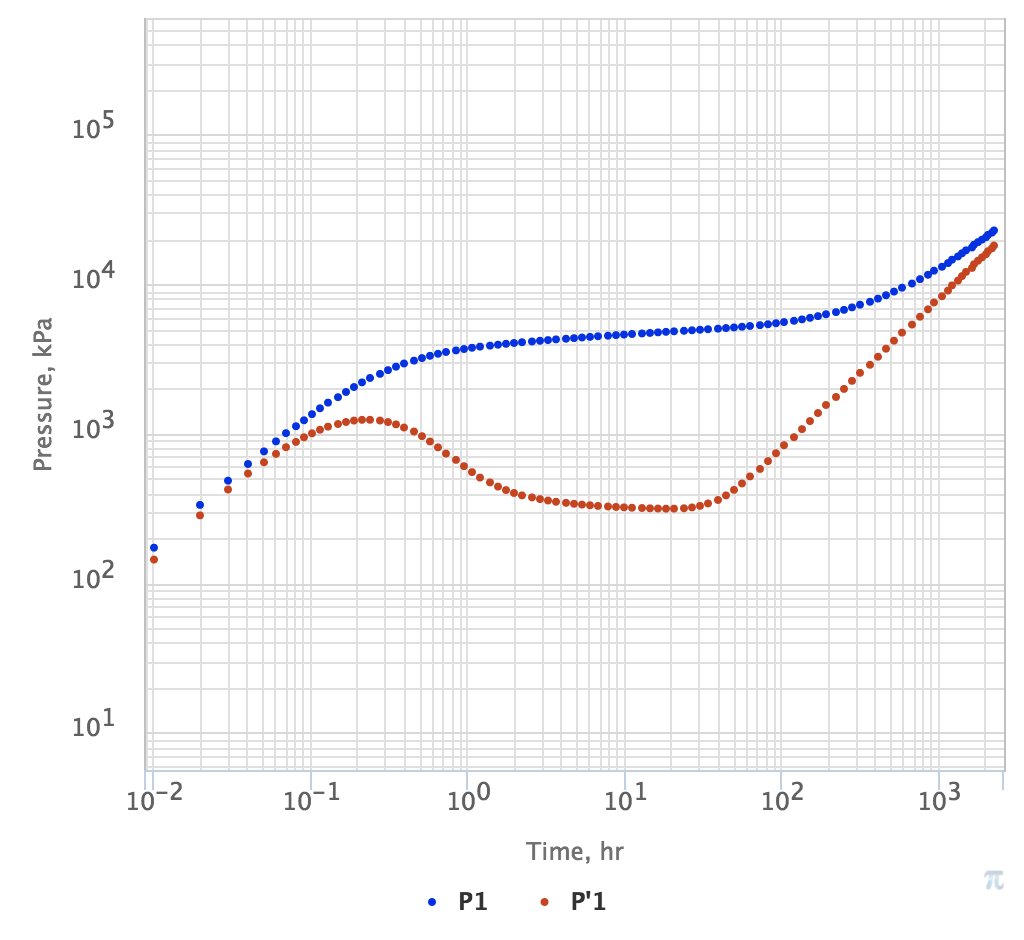
A bilogarithmic plot of pressure drop and its log-derivative.
|
Fig. 1. Example of pressure log-log plot showing DTR Pressure drop P in blue and log-derivative P' in red |
See Also
...
Petroleum Industry / Upstream / Subsurface E&P Disciplines / Well Testing / Pressure Testing / Pressure Transient Analysis (PTA) / PTA Diagnostic Plot
...