...
|
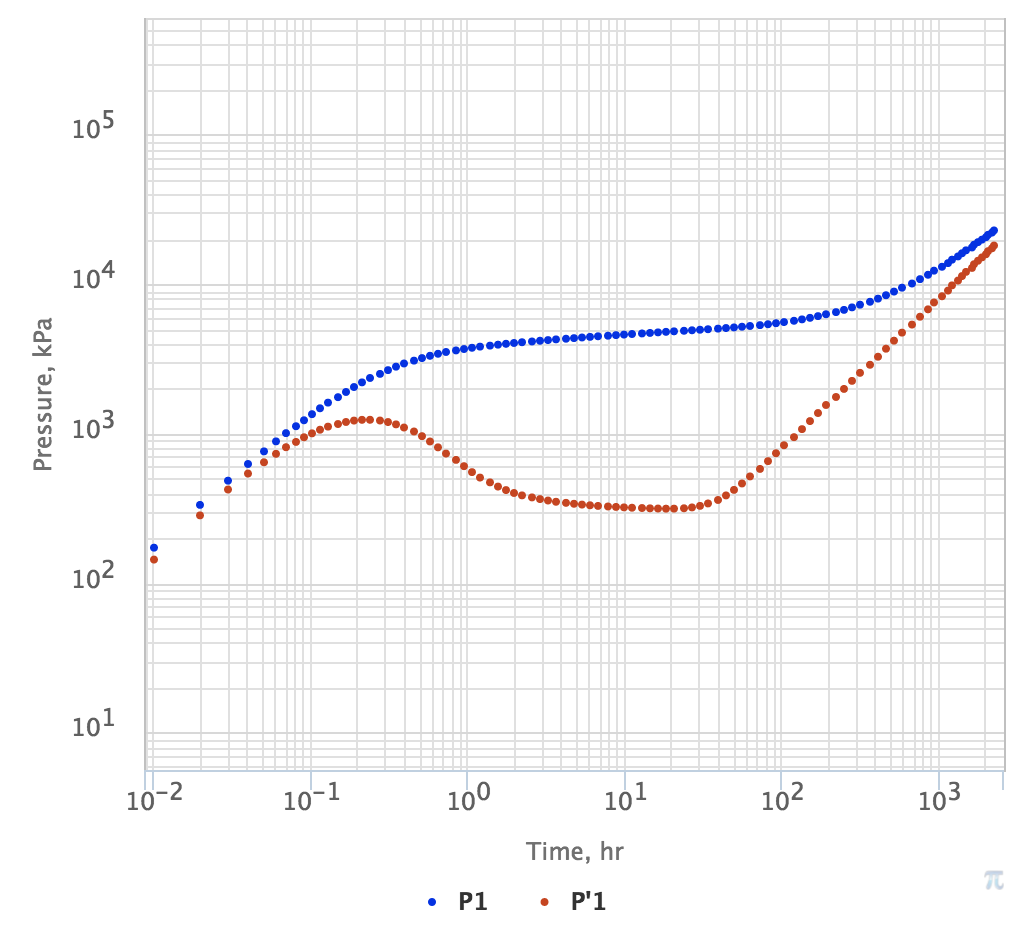
Fig. 1. PTA Diagnostic Plot for vertical well in single-layer homogeneous reservoir with impermeable circle boundary (PSS). Pressure is in blue and log-derivative is in red. |
See Also
...
Petroleum Industry / Upstream / Production / Subsurface Production / Field Study & Modelling / Production Analysis / PSS Diagnostics
[ Steady State (SS) well fluid flow regime ]