...
|
|
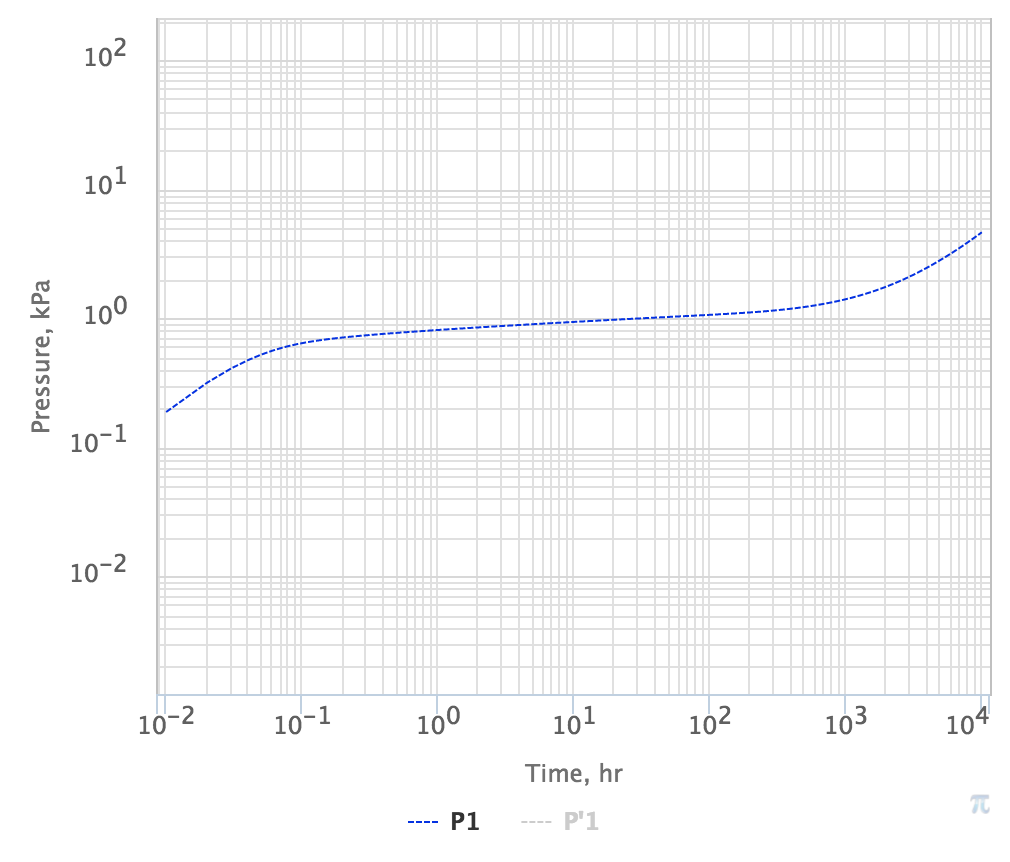
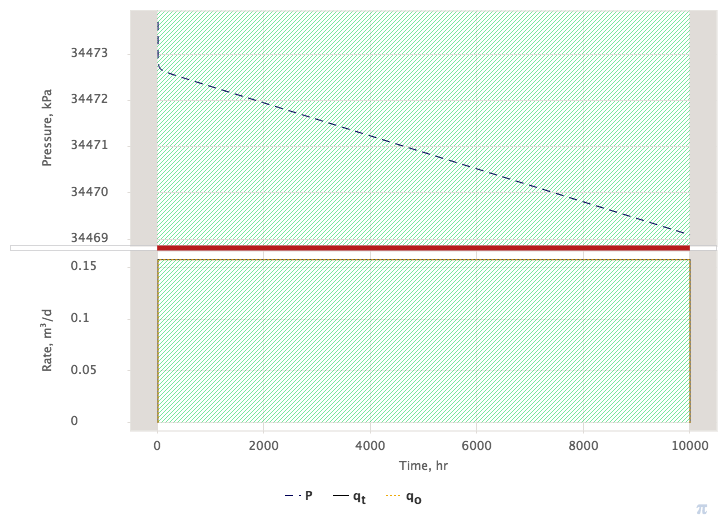
Fig. 1. A sample of typical pressure drop P (in blue ) derived from them BHP data records (Fig. 2) and presented in at log-log plot and usually used in PTA type-library analysis | Fig. 2. A source BHP data records which lead to a pressure drop on Fig. 1 |
...