These days a lot of producing wells is equipped with permanent Downhole Gauges (PDG), particularly in ESP wells.
Given a fact the production rates are constantly changing for technical reasons this allows studying the PDG response to the interference with offset wells. Despite of an obvious appeal this idea has a number of substantial drawbacks:
- Low sensitivity of most PDGs
It's usually around 15 psi with ability to be programmed for 1.5 psi which is still very poor for the purposes of corse-well interference analysis.
Besides most of PDG data today has been already recorded in 15 psi mode even though these Pigs allow 1.5 psi mode.
- Poor time-step in PDG readings
It's normal practise to record PDG with hourly or even daily step which is too rough for pressure interference analysis
- Poor tracking at injecting wells
Very often injectors are equipped with line gauges before the choke and can not sense the small pressure variations at the well bottom.
In some case injection THP is set after choke and can respond to formation pressure variations – although with much worse sensitivity than downhole gauges due to the damping factor of borehole fluid.
The efficient method to analyse the historical PDG recordings today is the multi-well Radial Deconvolution which is built around a rate and PDG history in producing well and production history in offset wells.
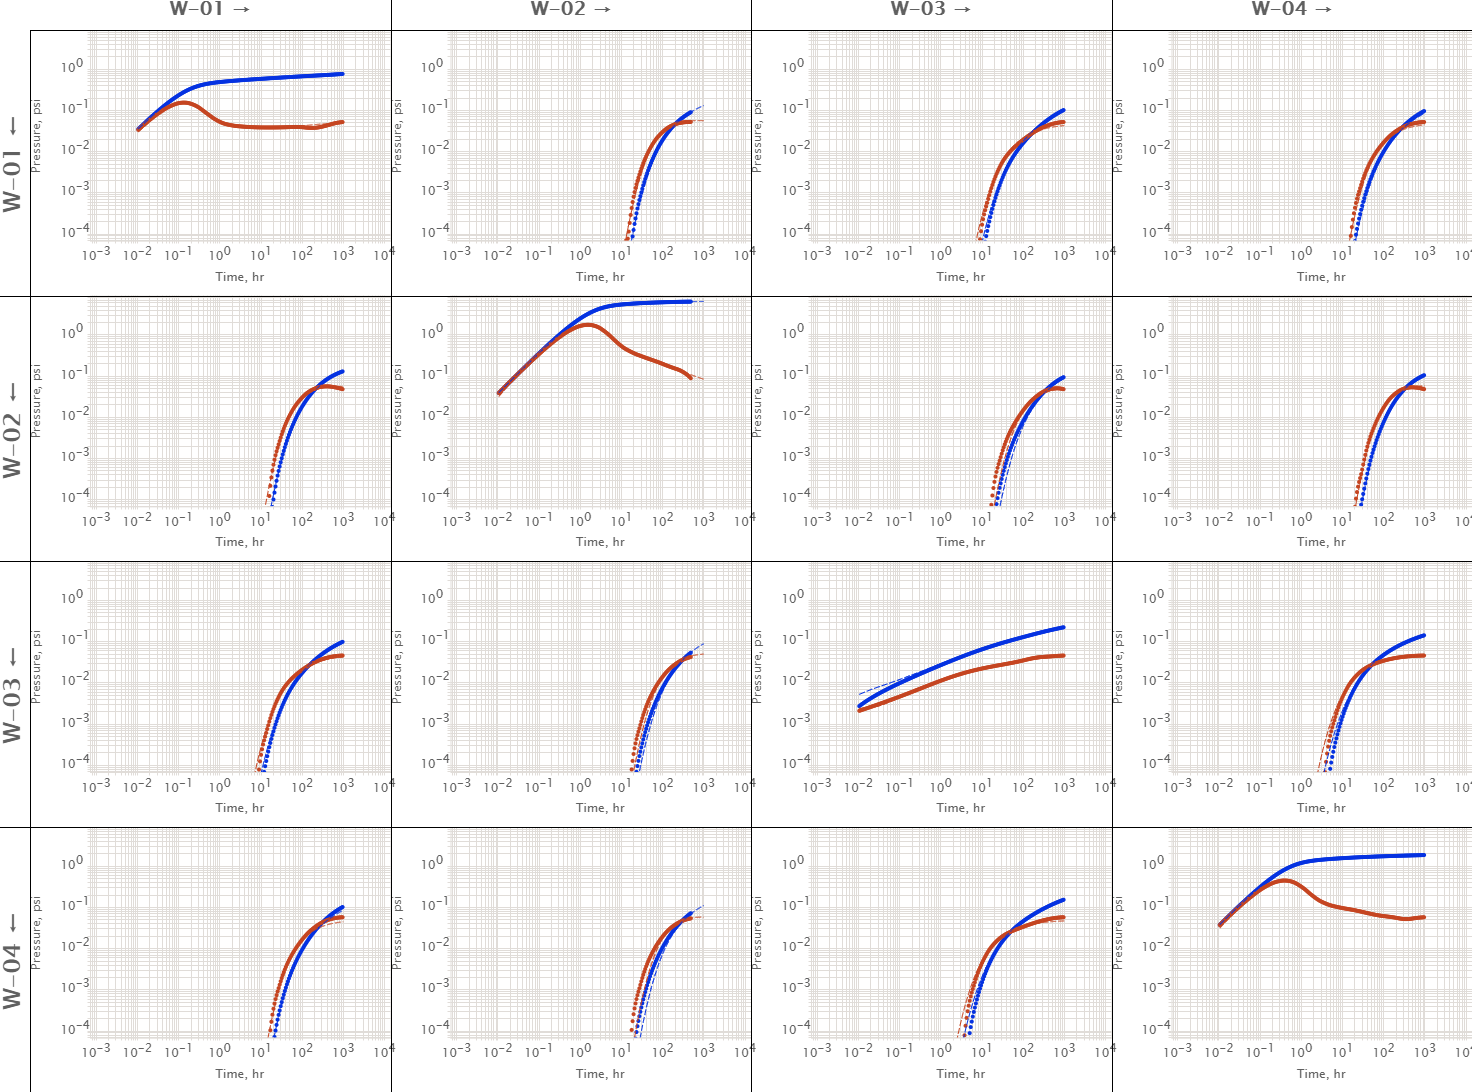
The results of the RDCV for N wells one gets N transient responses (TR):
- One Drawdown transient response (DTR) for the PDG well which characterises the pressure response of the PDG well to its own rate variation
- N – 1 cross-well transient responses (CTR) for the interval between PDG and each of the N –1 surrounding wells and which characterises the impact the surrounding wells provide on the formation pressure in PDG well
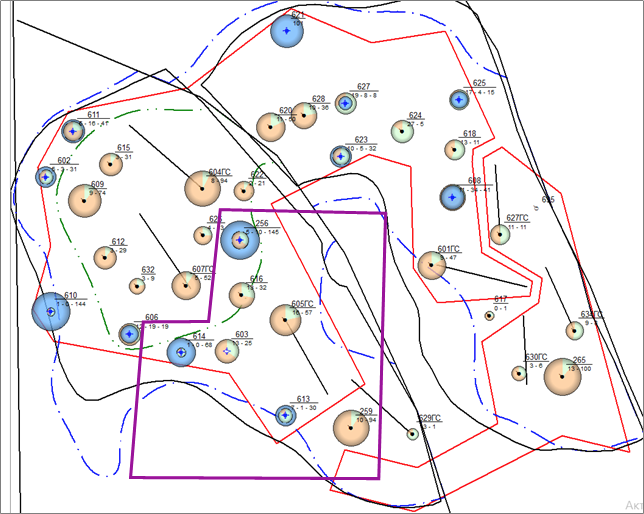 Image Added Image Added
Due to a poor pressure readings the quality of TR will be poor as well and not often they can interpreted in terms of transmissibility and diffusivity.
Particularly it is very rare when this type of TR can reveal fracture development or skin-factor.
But nevertheless it is still capable to assess formation pressure in PDG well quite accurately.
Below is the moist of the reliable deliverables one can get from RDCV in popular cases:
- Formation pressure in PDG well at any time in the past
- Comparative contribution oif the surrouding wells to the formation pressure in PDG well
- Qualitative assesment of the future formation pressure dynamic in PDG well under the arbitrary rate scenario in surrounding wells (whether it will grow or decline or stay flat)
- Rate History correction of the PDG well which can be sed in realшocstion for accurate full-field simulations.
This set of information represent a high value for reservoir engineers for daily planning and also valuable for simulation engineers for 3D model calibration. The weakest point of RDCB is its inability to distinguish the contour button off two (or more) wells which were changing its rate synchronously (or did not change it at all) during the whole time of the PDG recordings. Case Study
Здесь напрашивается хороший пример по РДКВ на основе ТМС с добывающими и нагнетательными скважинами – бросьте картинки и я напишу текст. (https://www.arax.team/company/personal/user/20/tasks/task/view/8642/)
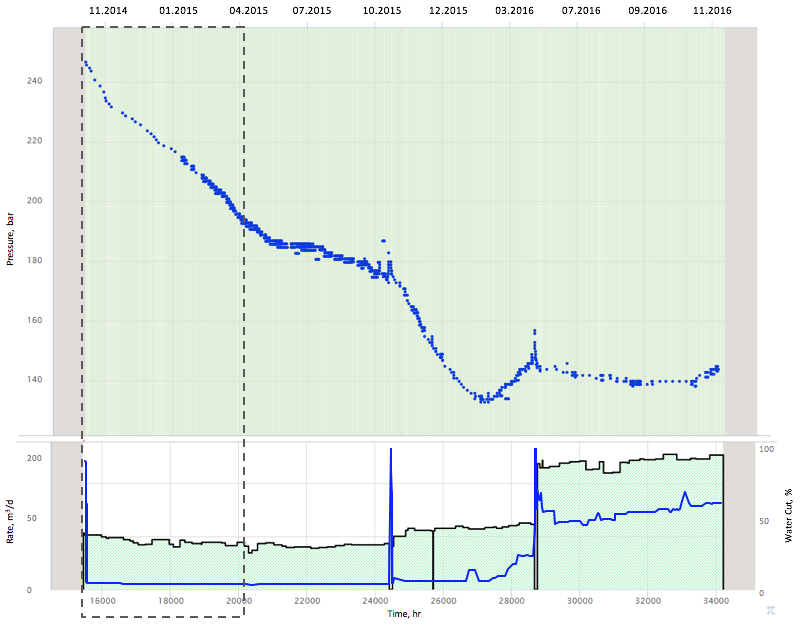 Image Added Image Added
Fig.1. Pressure and Rate history at producing well OP-6 Должна быть картинка иллюстрирующая грубую запись давления ТМС, грубую запись нагнетательной скважины (https://www.arax.team/company/personal/user/20/tasks/task/view/8642/) 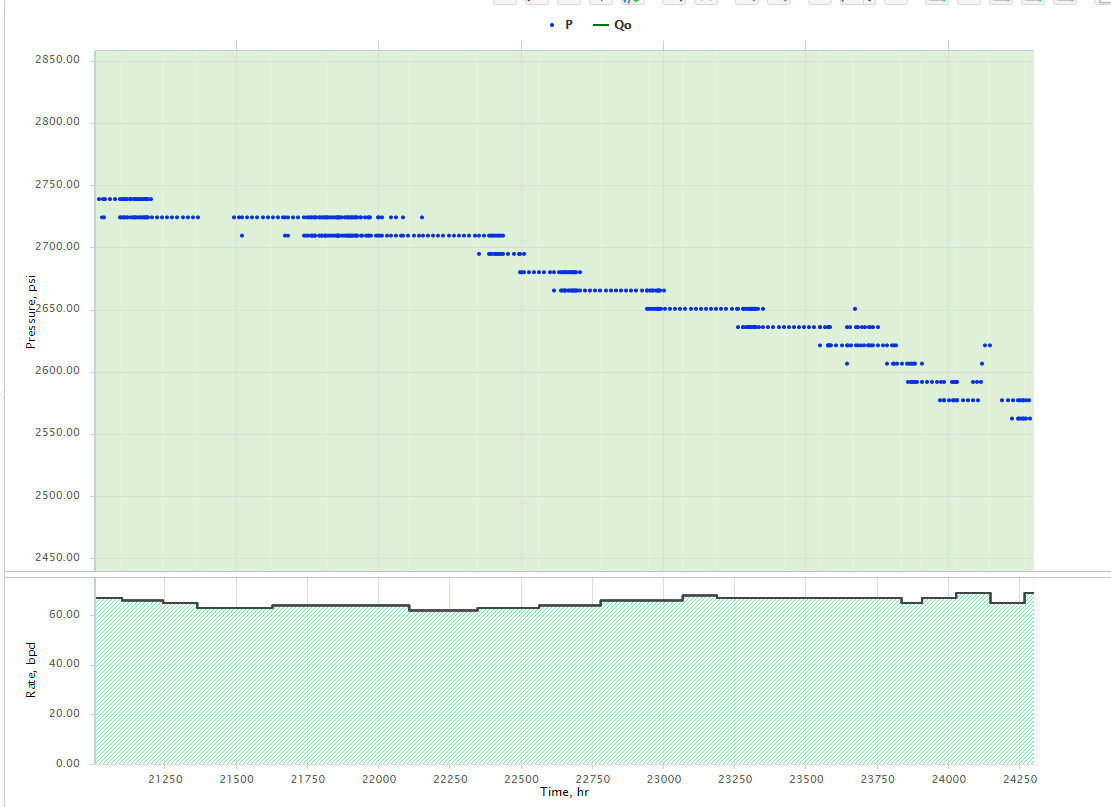 Image Added Image Added
Fig. 2. Pressure and Rate history at injecting well Wl4
Image Added
Fig. 3. Cumulative Withdrawals at 01.05.17 (with underlying thikness map) 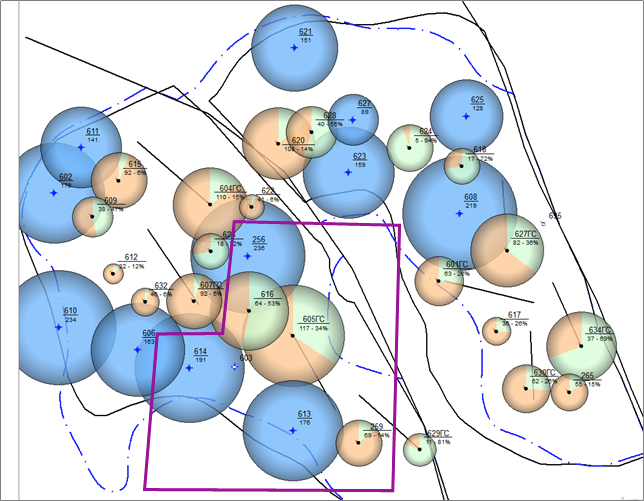 Image Added Image Added
Fig. 4. Current Withdrawals at 01.05.17 (with underlying thinkness map) 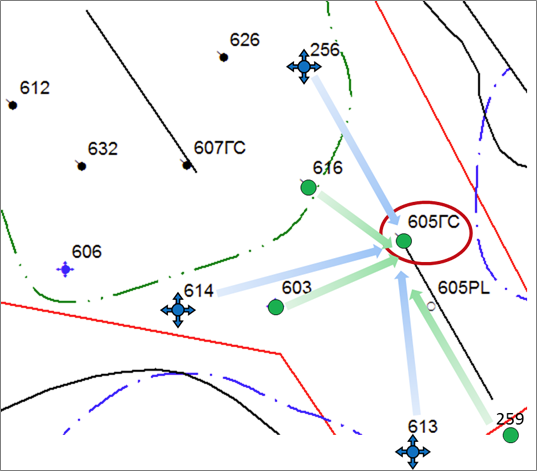 Image Added Image Added
Портянка (https://www.arax.team/company/personal/user/20/tasks/task/view/8642/)
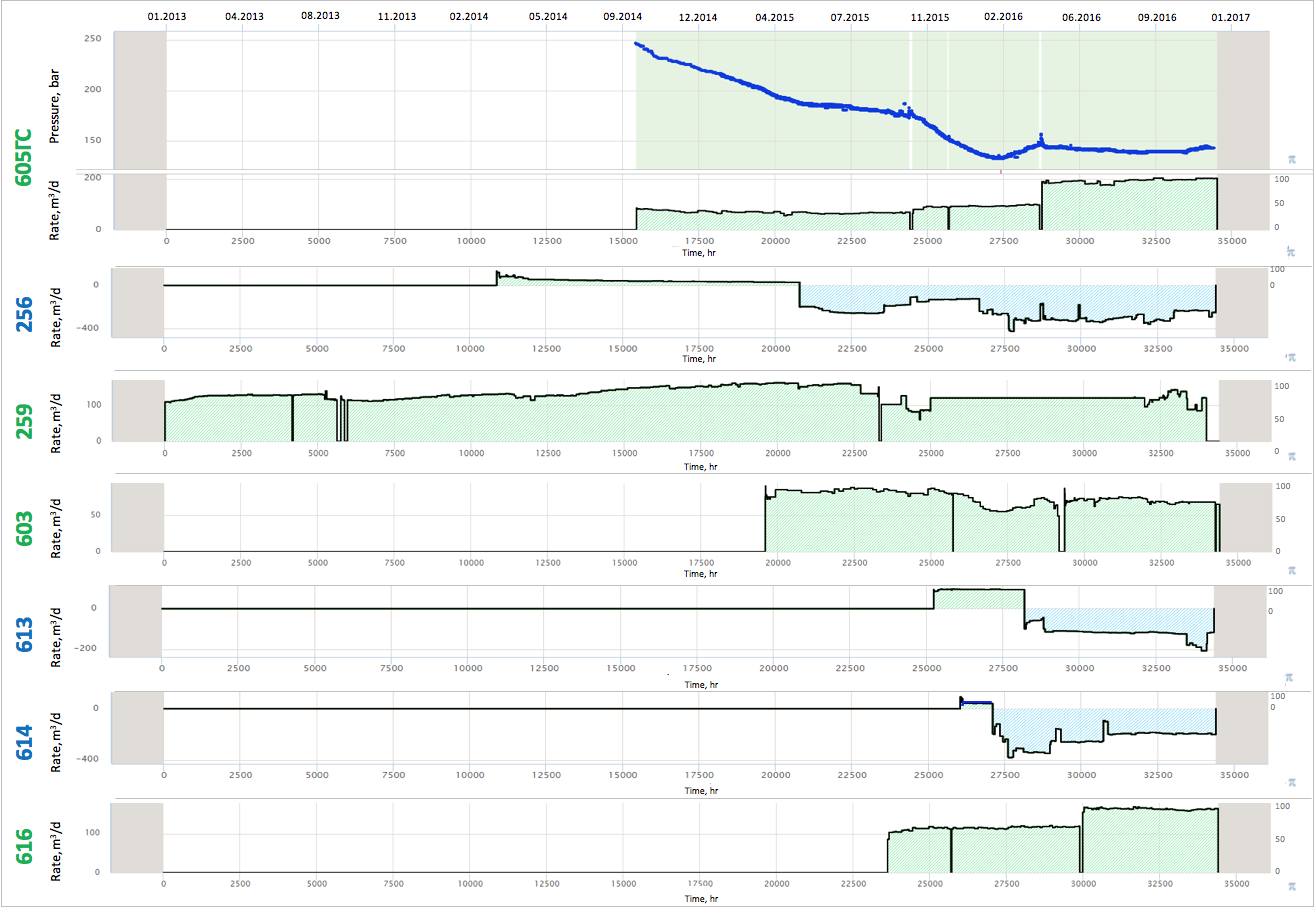 Image Added Image Added
Рис.5. Pressure and Rate history of well OP-6 и and rate history of surrounding wells. ПХ (https://www.arax.team/company/personal/user/20/tasks/task/view/8642/) 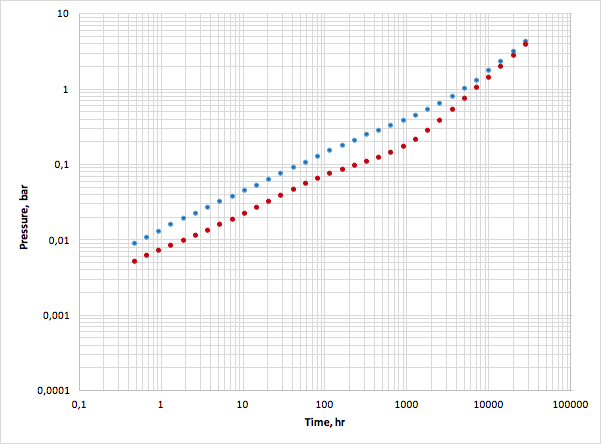 Image Added Image Added
| | Fig.6. DTR for OP-6 → OP-6 |
Динамика пластового давления центральной скважины (https://www.arax.team/company/personal/user/20/tasks/task/view/8642/)
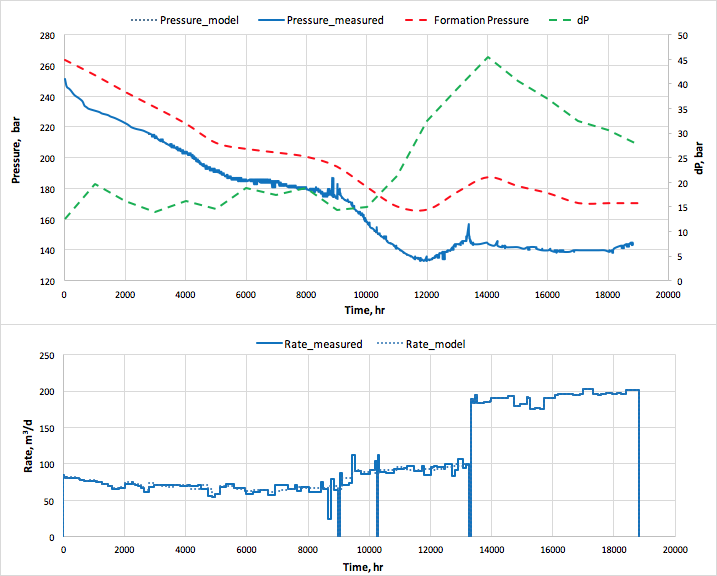 Image Added Image Added
| Fig. 7. Reconstruction of formation pressure history and delta pressure at well OP-6 |
Сравнительный вклад окружающих скважин в пластовое давление по центральной скважине (https://www.arax.team/company/personal/user/20/tasks/task/view/8642/)
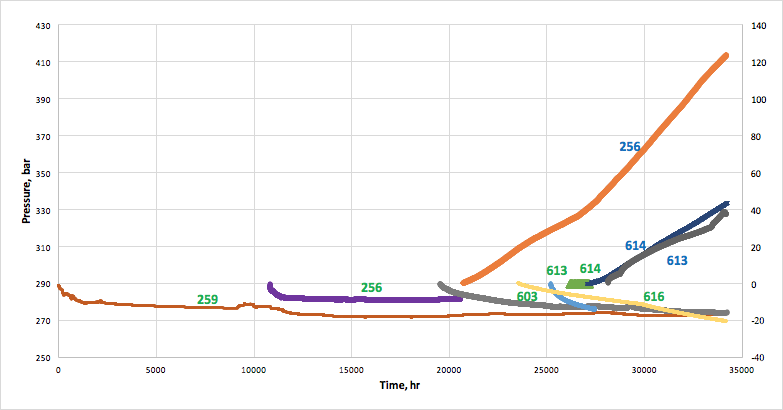 Image Added Image Added
| 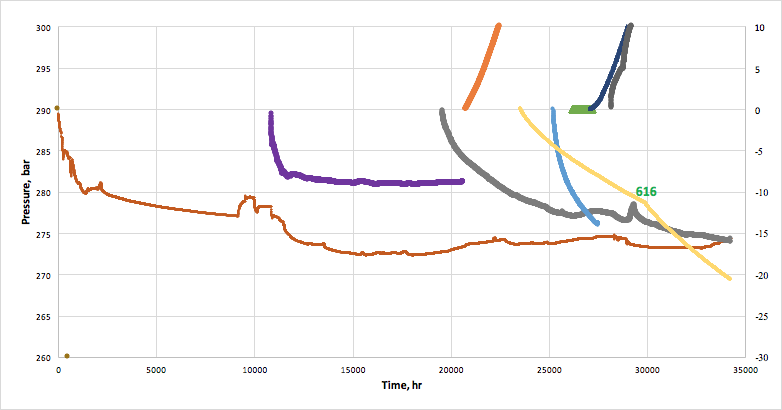 Image Added Image Added
| | Fig. 8. Impact from offset Wells on formation pressure in OP-6 | Fig. 9. Impact from offset Wells on formation pressure in OP-6 (zoom) |
Коррекция дебитов по центральной скважине – зум вокруг явной ошиьки в исторической записи (https://www.arax.team/company/personal/user/20/tasks/task/view/8642/) 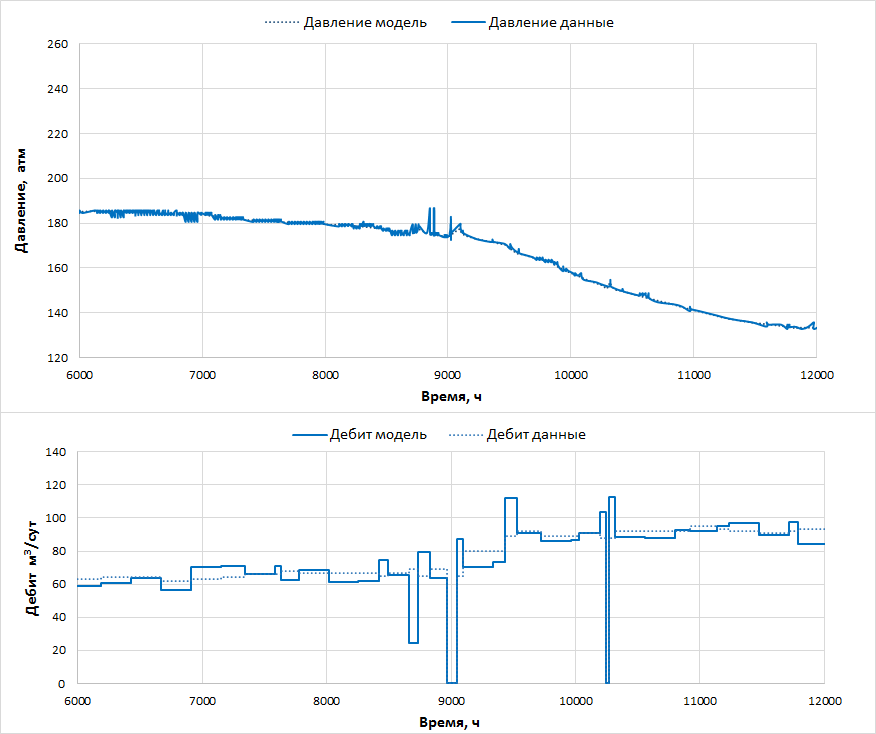 Image Added Image Added Рис. 9. Rate correction at well OP-6
|