A Phase Equilibrium Boundary on Phase Equilibrium Diagram separating the single-phase vapour region and 2-phase liquid-vapour region on PT Diagram (see Fig. 1).
The slightest pressure drop or temperature increase results in liberation of the first bubble of vapour forming a 2-phase liquid-vapour system.
|
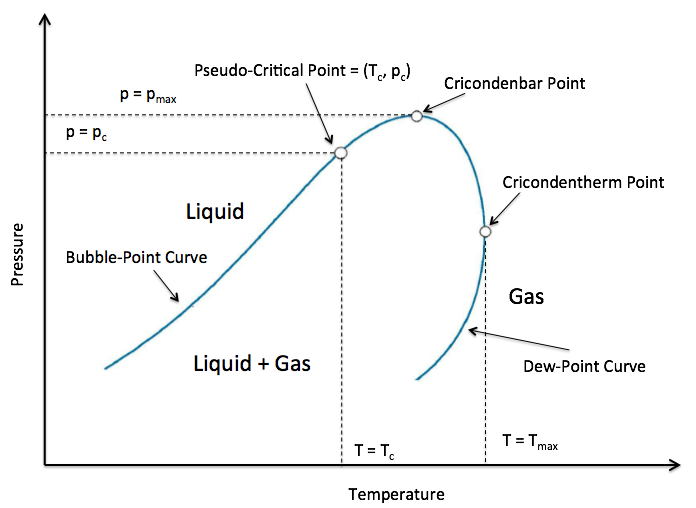
| Fig. 1. Schematic PT Diagram with Vapour Liquid Equilibrium area and Cricondenbar Point. |
See also
Natural Science / Physics / Thermodynamics / Thermodynamic system / Thermodynamic equilibrium / Phase Equilibrium / Vapour Liquid Equilibrium (VLE)
[ State of matter ][ Pure substance ] [ Mixtures ][ Fluid Mixtures ] [ Phase ]
[ Сritical Temperature Tc ] [ Critical Pressure (pc) ]