|
|
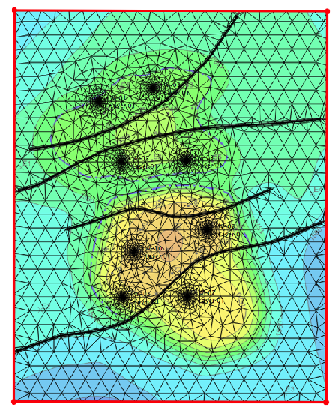
| Fig. 1. Example of Delaunay grid in PTM | Fig. 2. Example of matching diagram of simulated UTRM against factual UTRM. |

See Also
Petroleum Industry / Upstream / Subsurface E&P Disciplines / Field Study & Modelling / Reservoir Flow Simulation / XPM
[ Pressure Testing ] [ Basic reservoir properties ] [ Complex reservoir properties ]