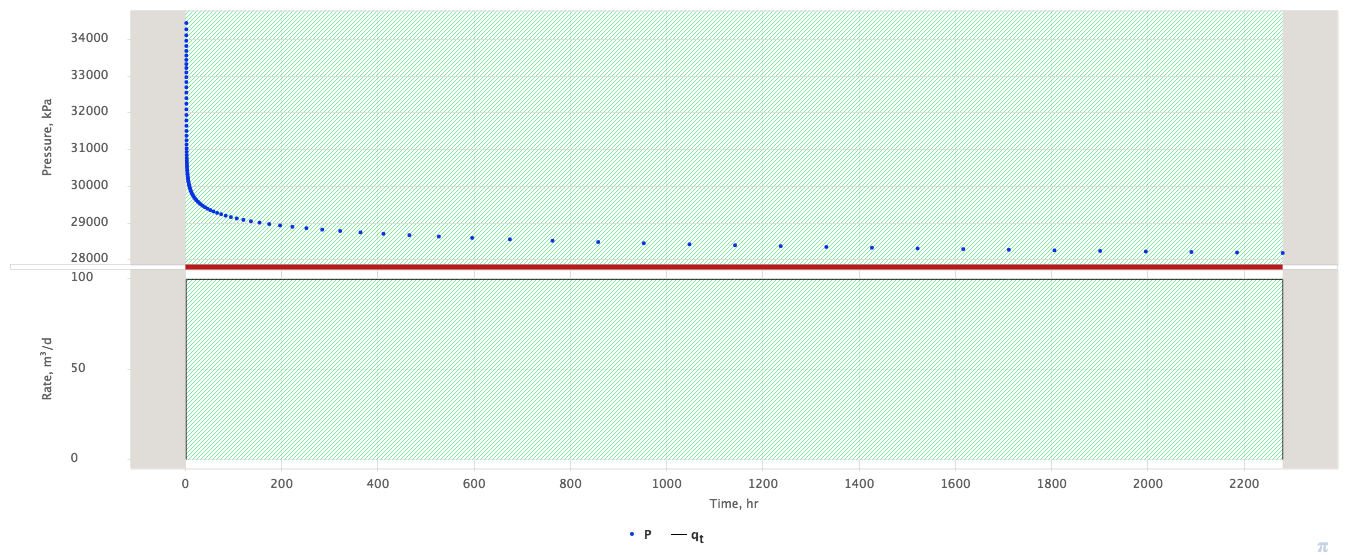
Pressure transient survey in producer during the pressure fall period caused by opening well for production or increasing its production rate (see Fig. 1):
|
Fig 1. Drawdown pressure decline (blue dots) for 2,300 hrs after opening the well for production at 100 m3/d. |
Interpretation
Interpretation of DD is based on:
- visual analysis of PTA diagnostic plot
- selecting pressure diffusion model from PTA Type Library
- fitting selected parameters of pressure diffusion model to pressure gauge data records