...
|
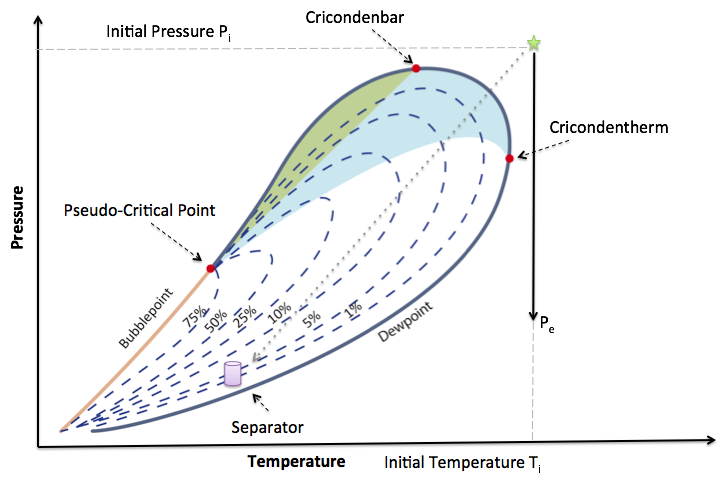
Fig. 1. Production path of the Wet Gas Reservoir on the Phase Equilibrium Diagram. The downward solid black arrow shows a reservoir pressure depletion path. The downward grey dash arrow shows a wellbore lift pressure drop path. |
See Also
...
Petroleum Industry / Upstream / Subsurface E&P Disciplines / Petroleum Geology / Petroleum Reservoir / Hydrocarbon reservoir / Natural Gas Reservoir
...